With our engineering background, we analyze data carefully to help you achieve the best outcomes. Below is a snapshot of the August 2025 real estate market in San Mateo, Santa Clara, and Alameda Counties.
County Insights
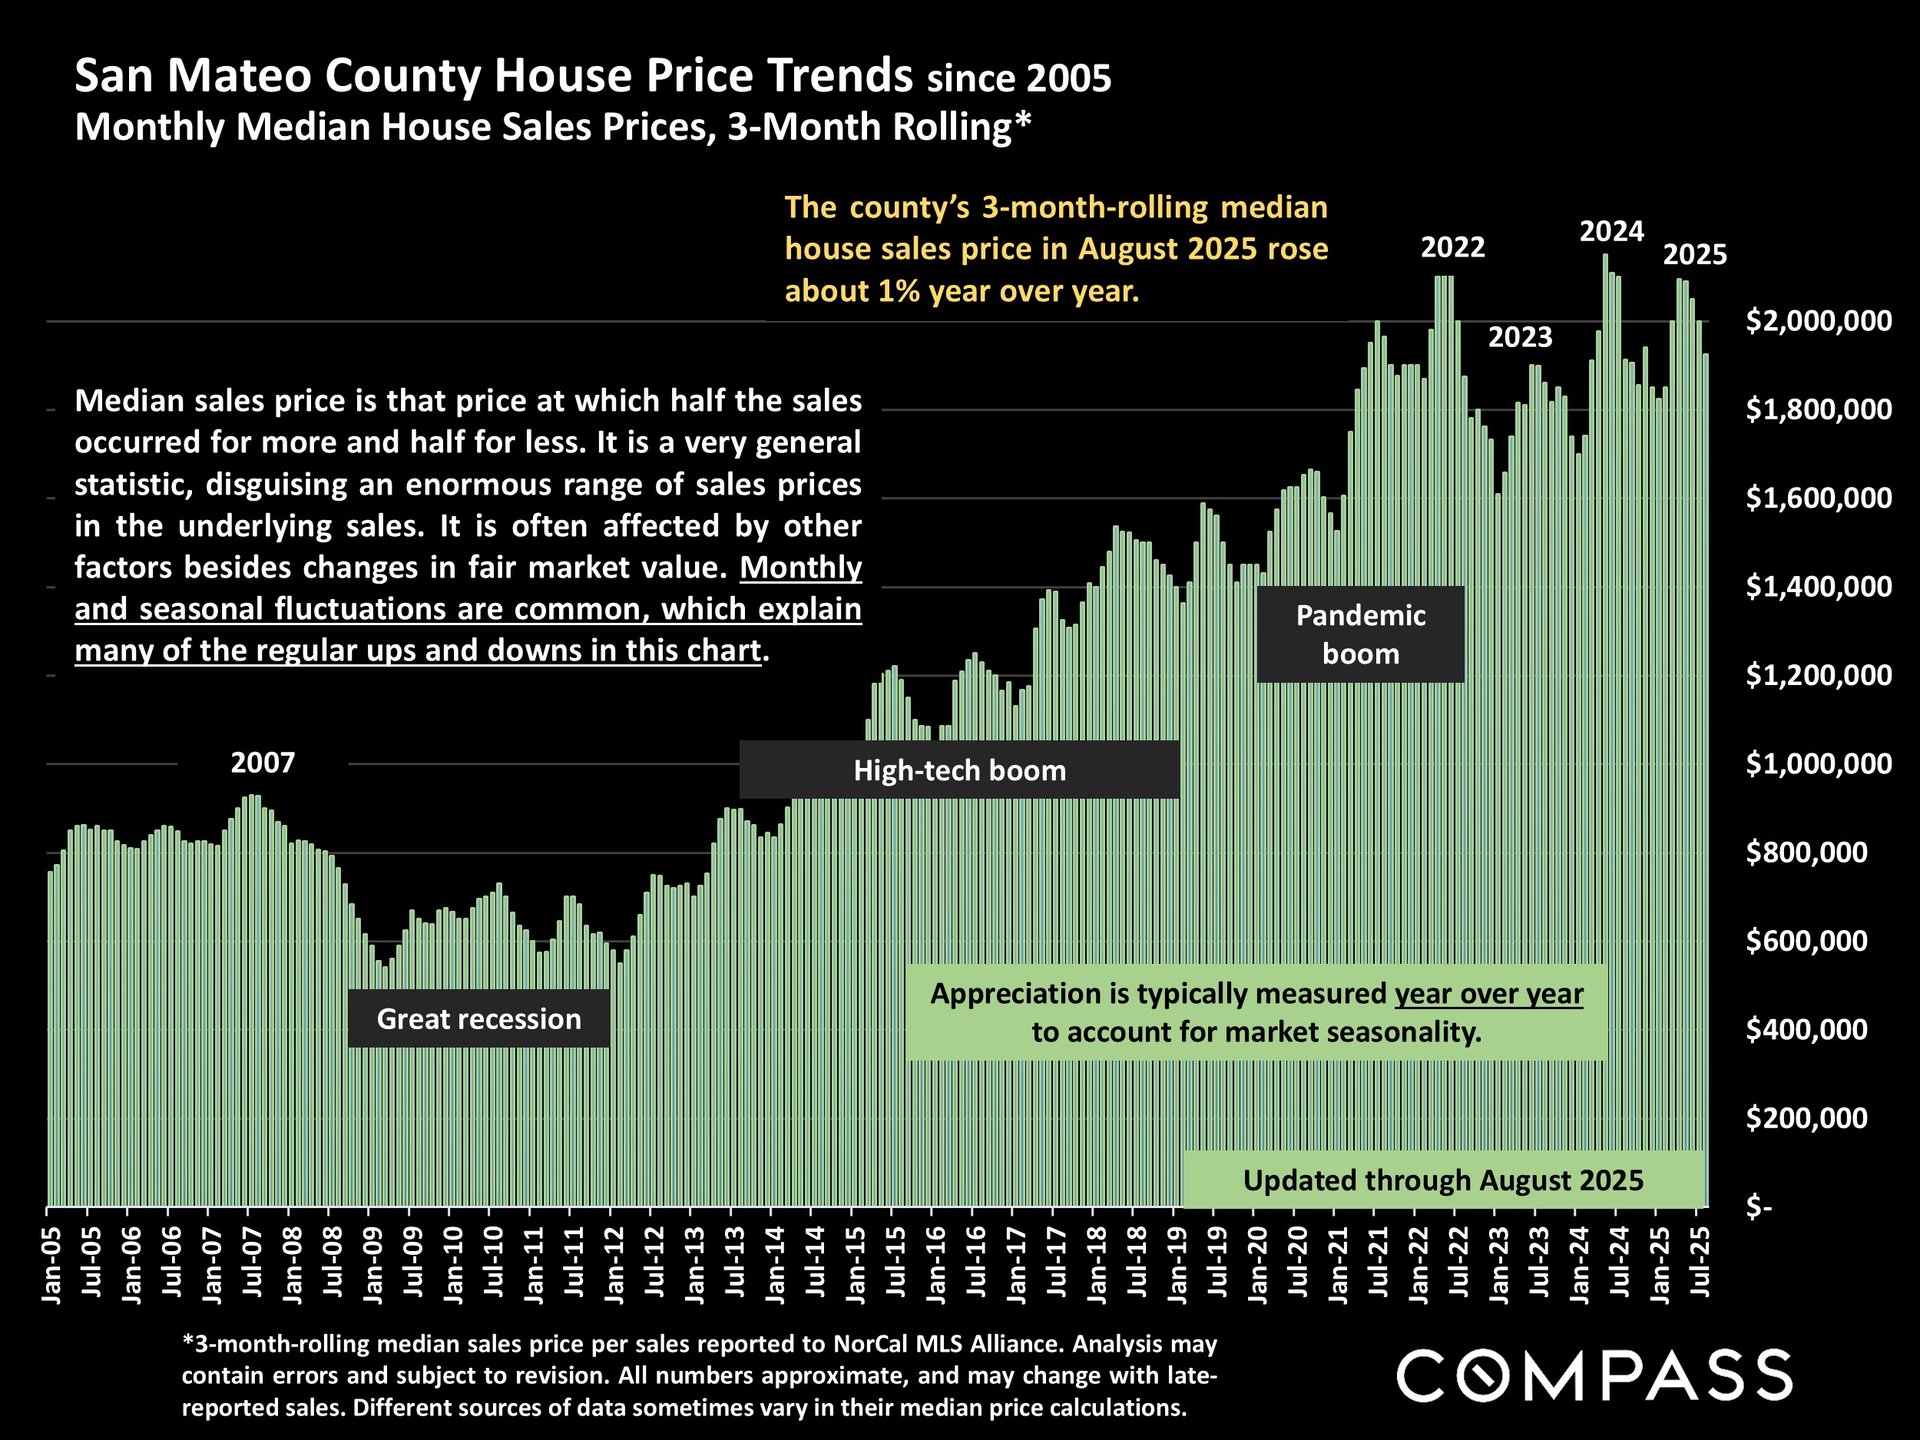
San Mateo County
Compared to July 2025, San Mateo continued to lose momentum:
-
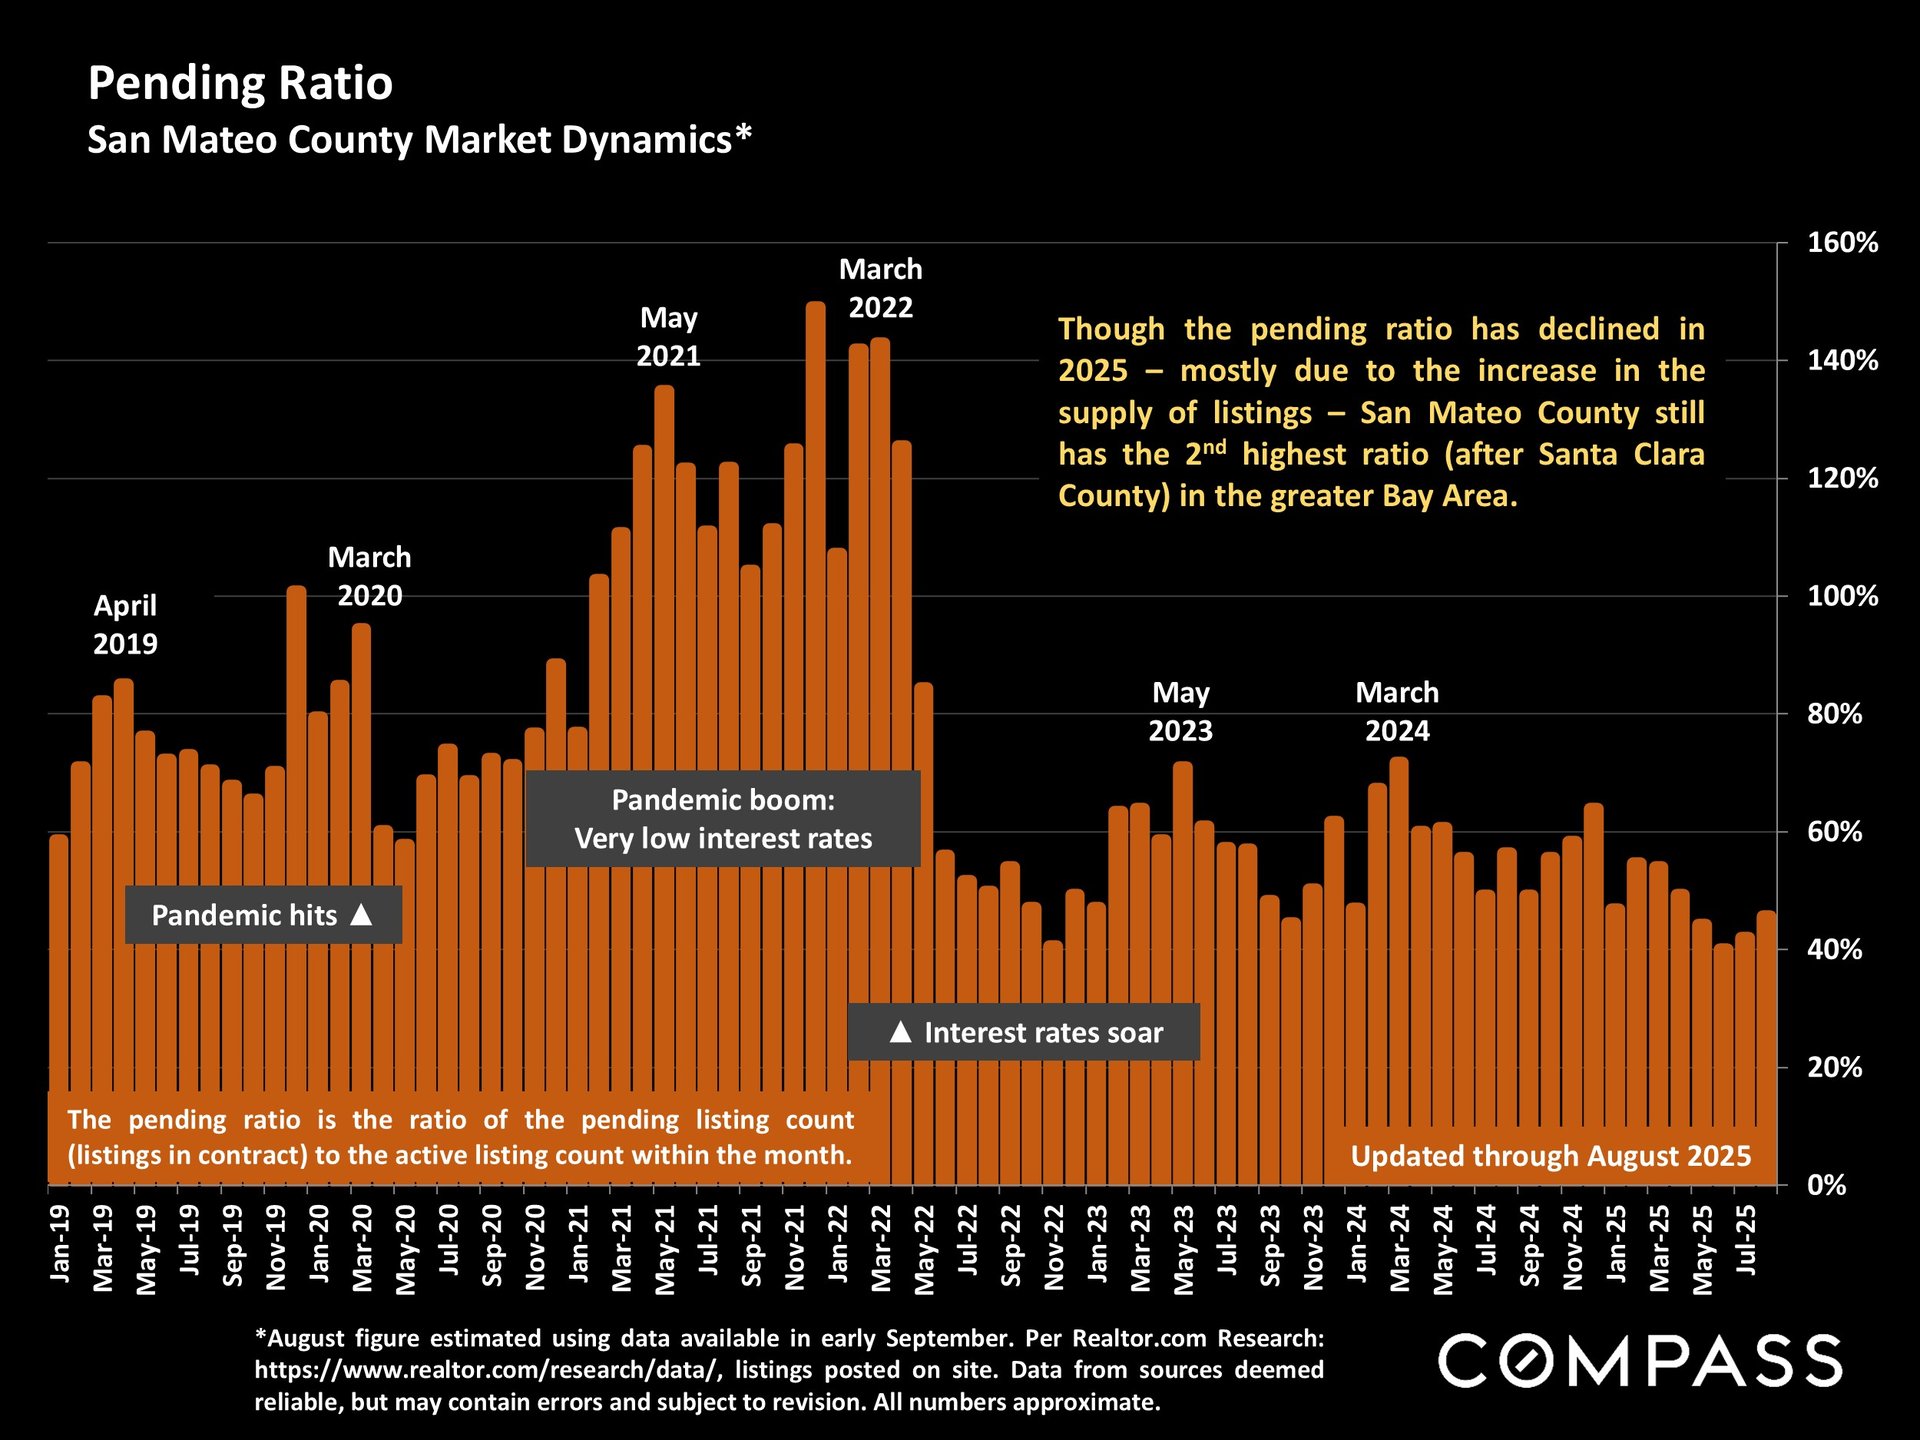
Overbidding dropped further (from 65% to 45% in July; now from 61% to 46%).
-
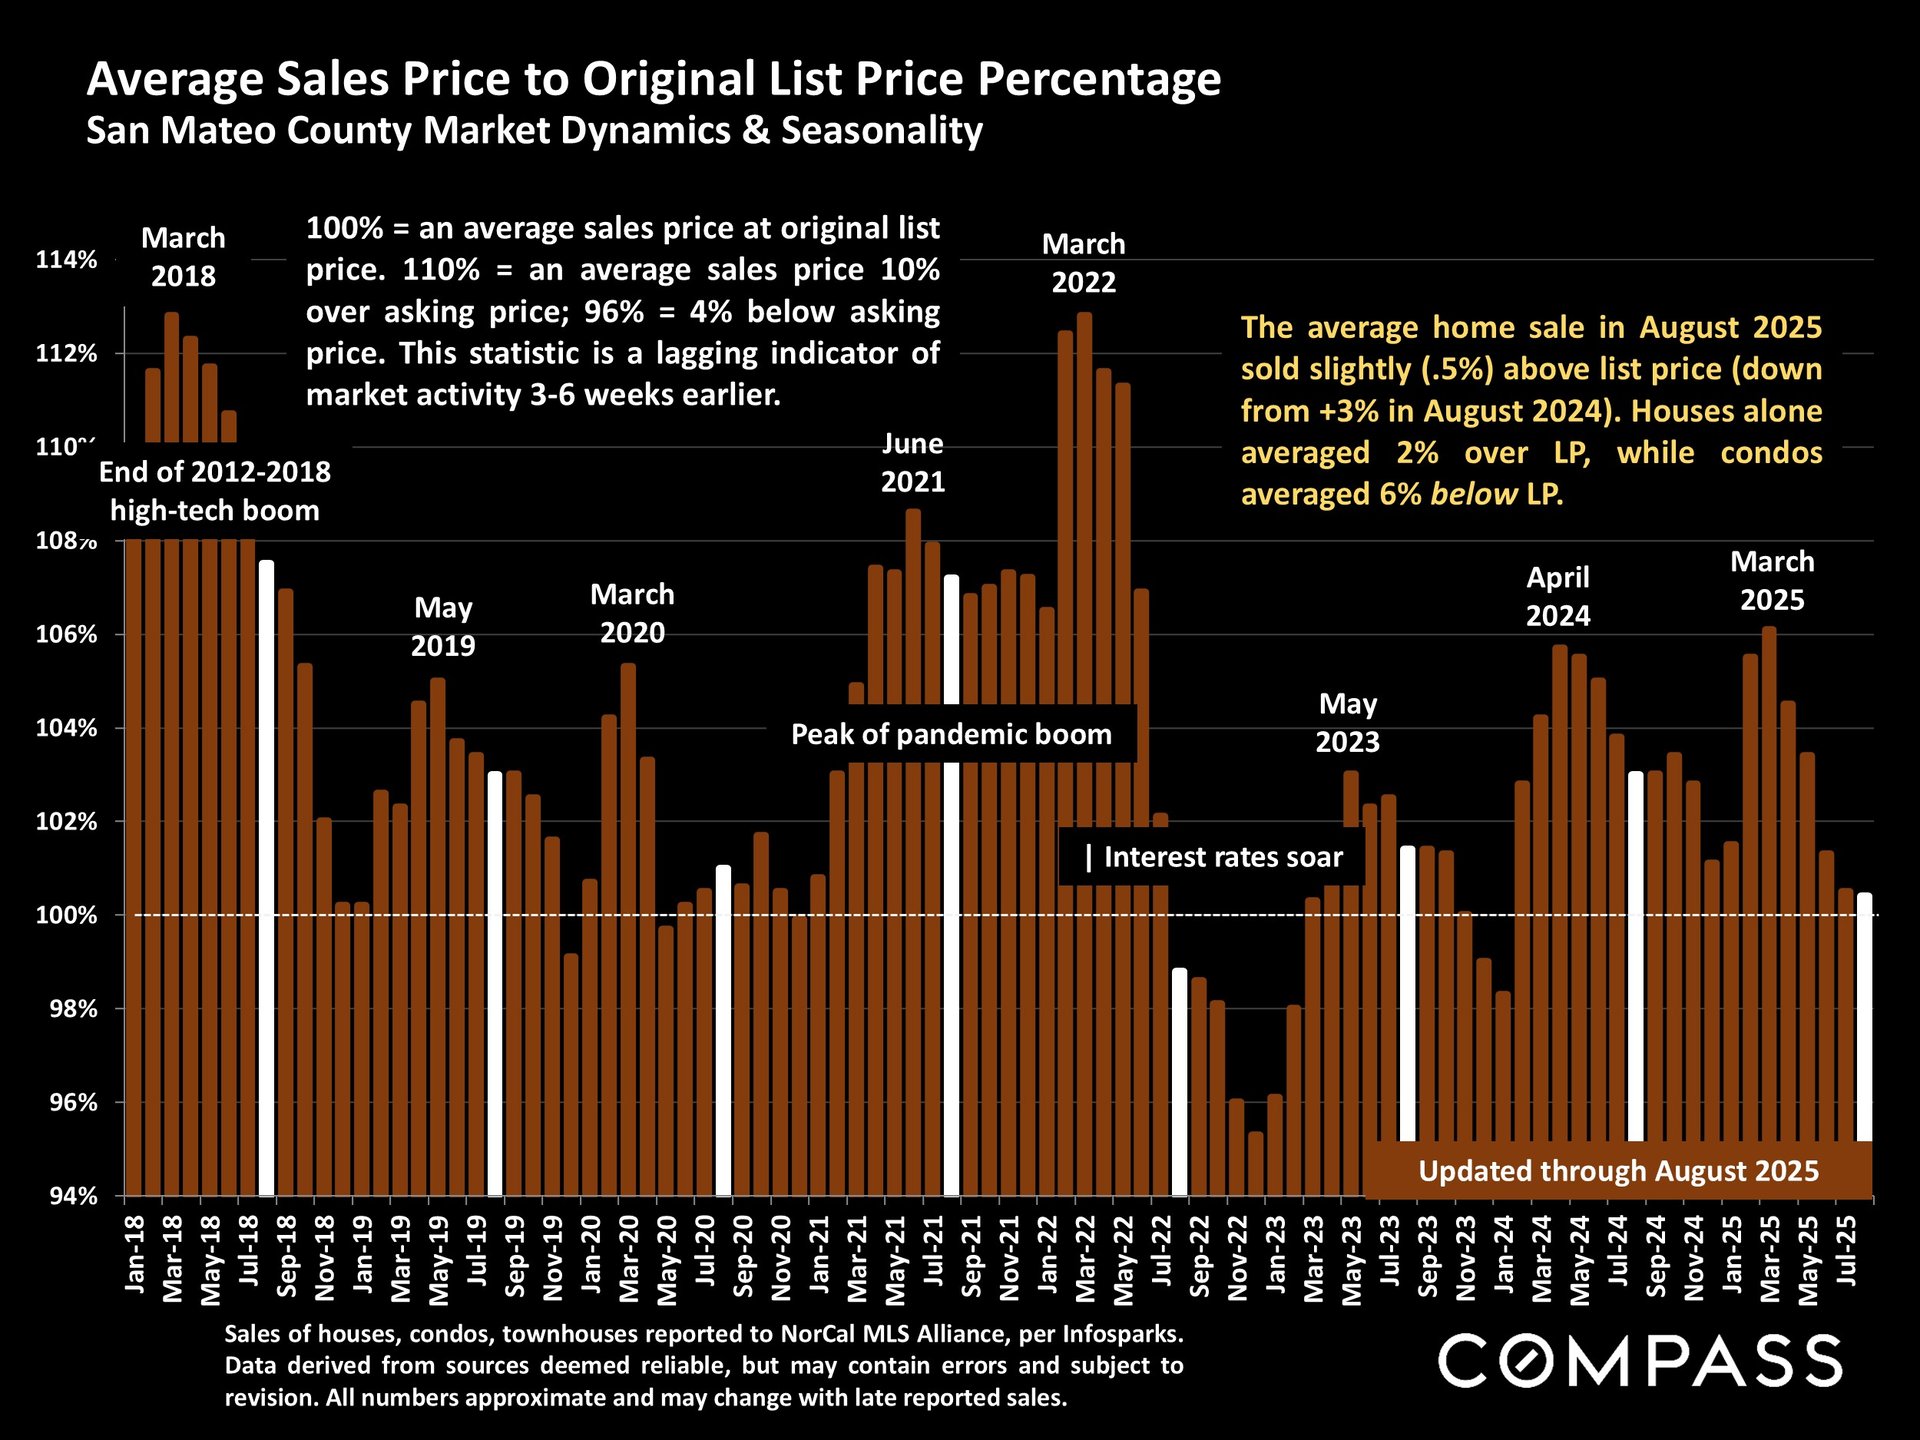
The sales price-to-list ratio weakened (from 103% to 99% in July; now from 102% to 100.5%).
-
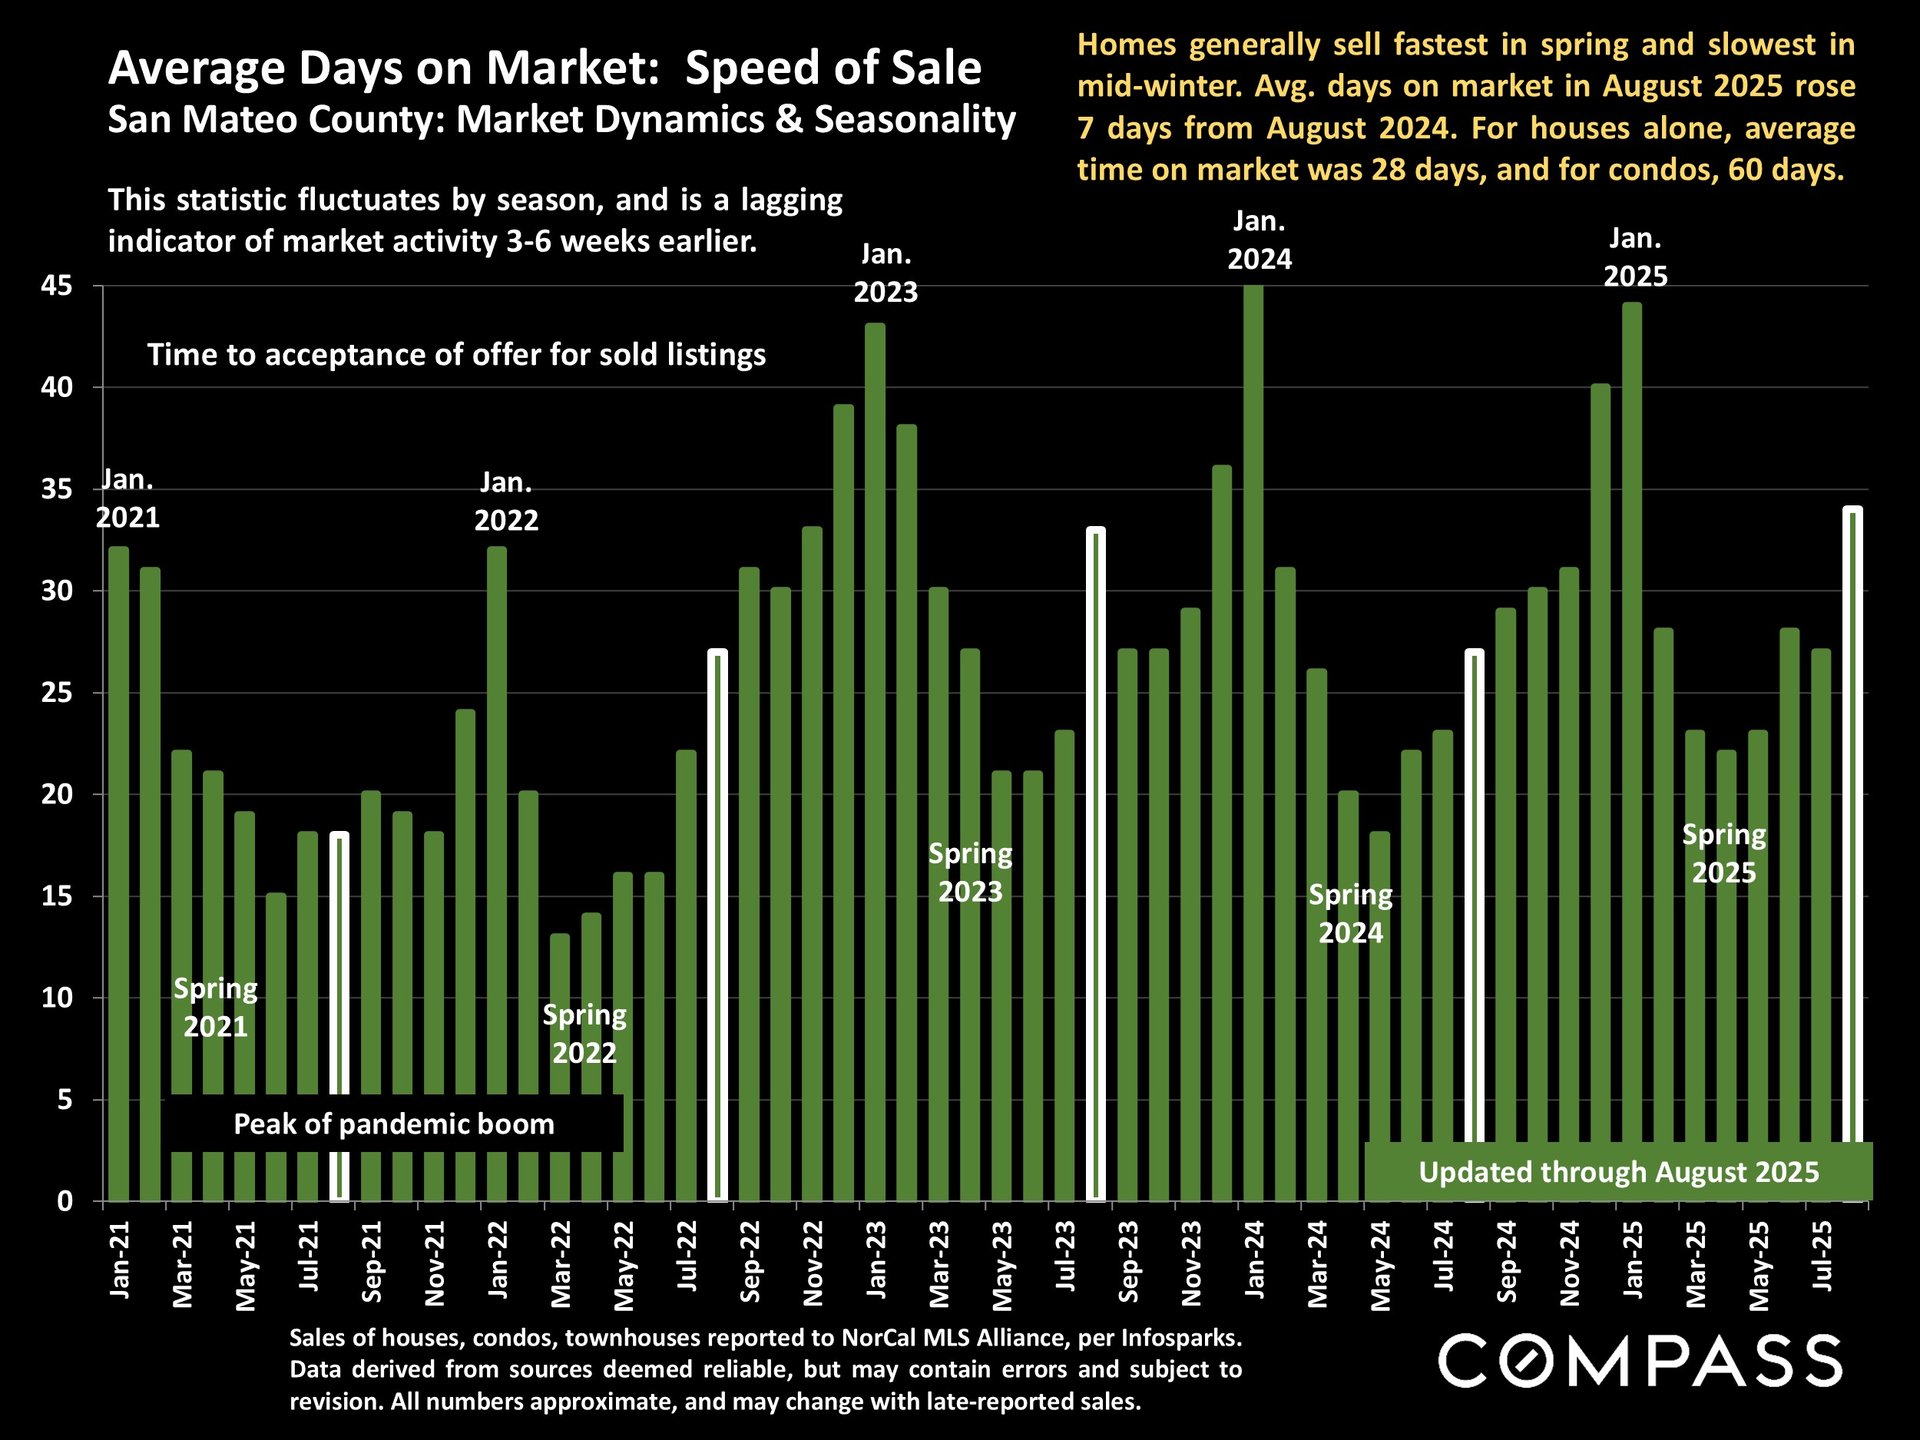
Days on market stretched longer (19 → 26 in July; now 21 → 28).
📌 Conclusion: San Mateo is clearly cooling, with more price cuts and slower sales. Still, prestige markets like Atherton and Hillsborough remain resilient, anchoring high-end demand.
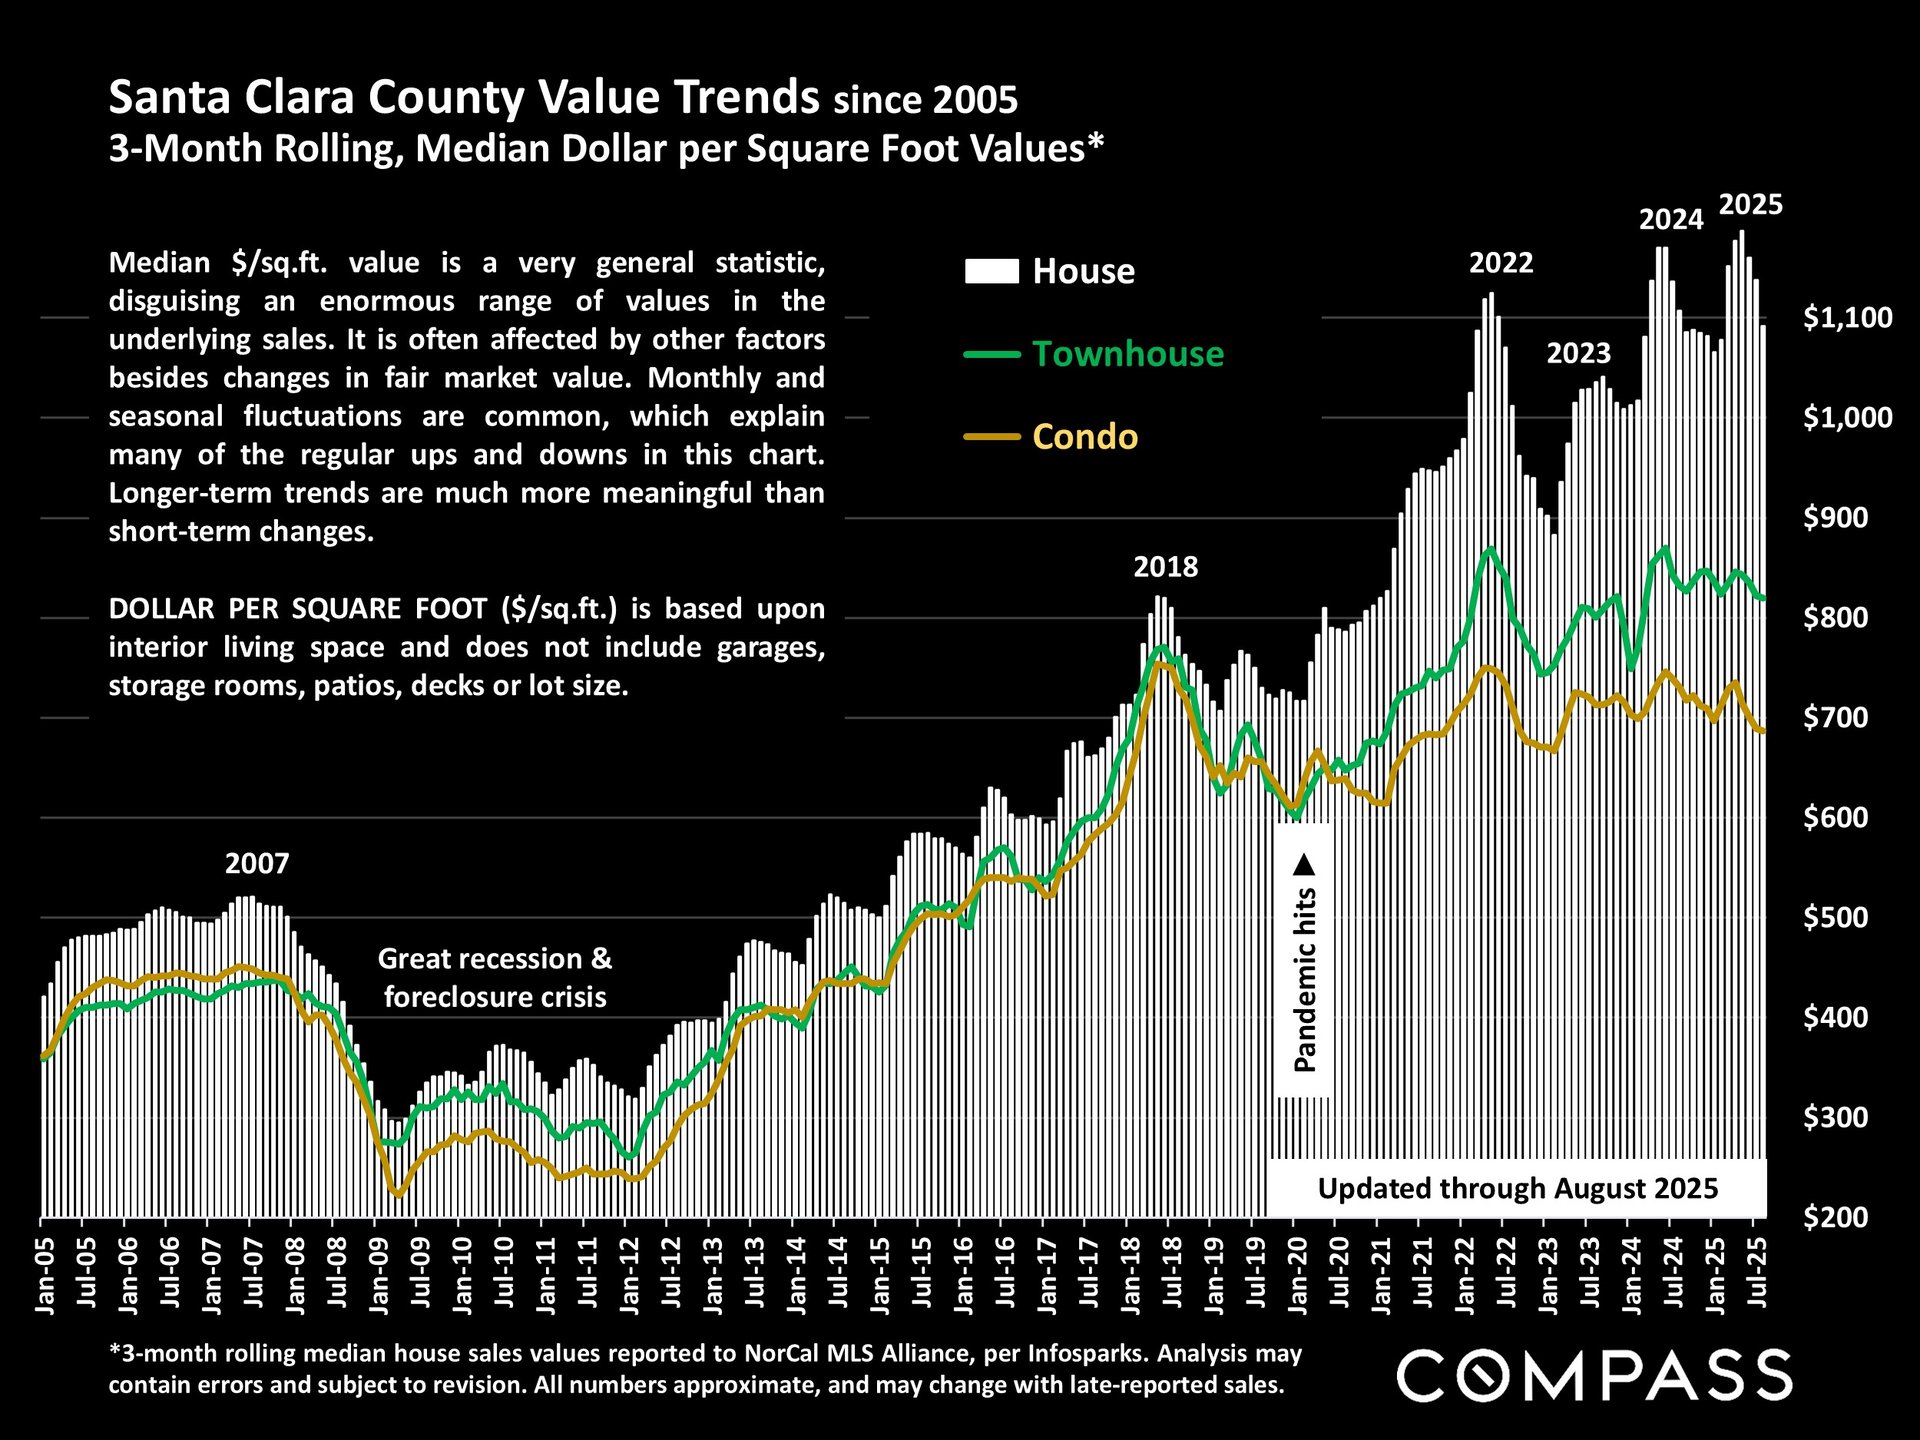
Santa Clara County
From July to August, Santa Clara also softened:
-
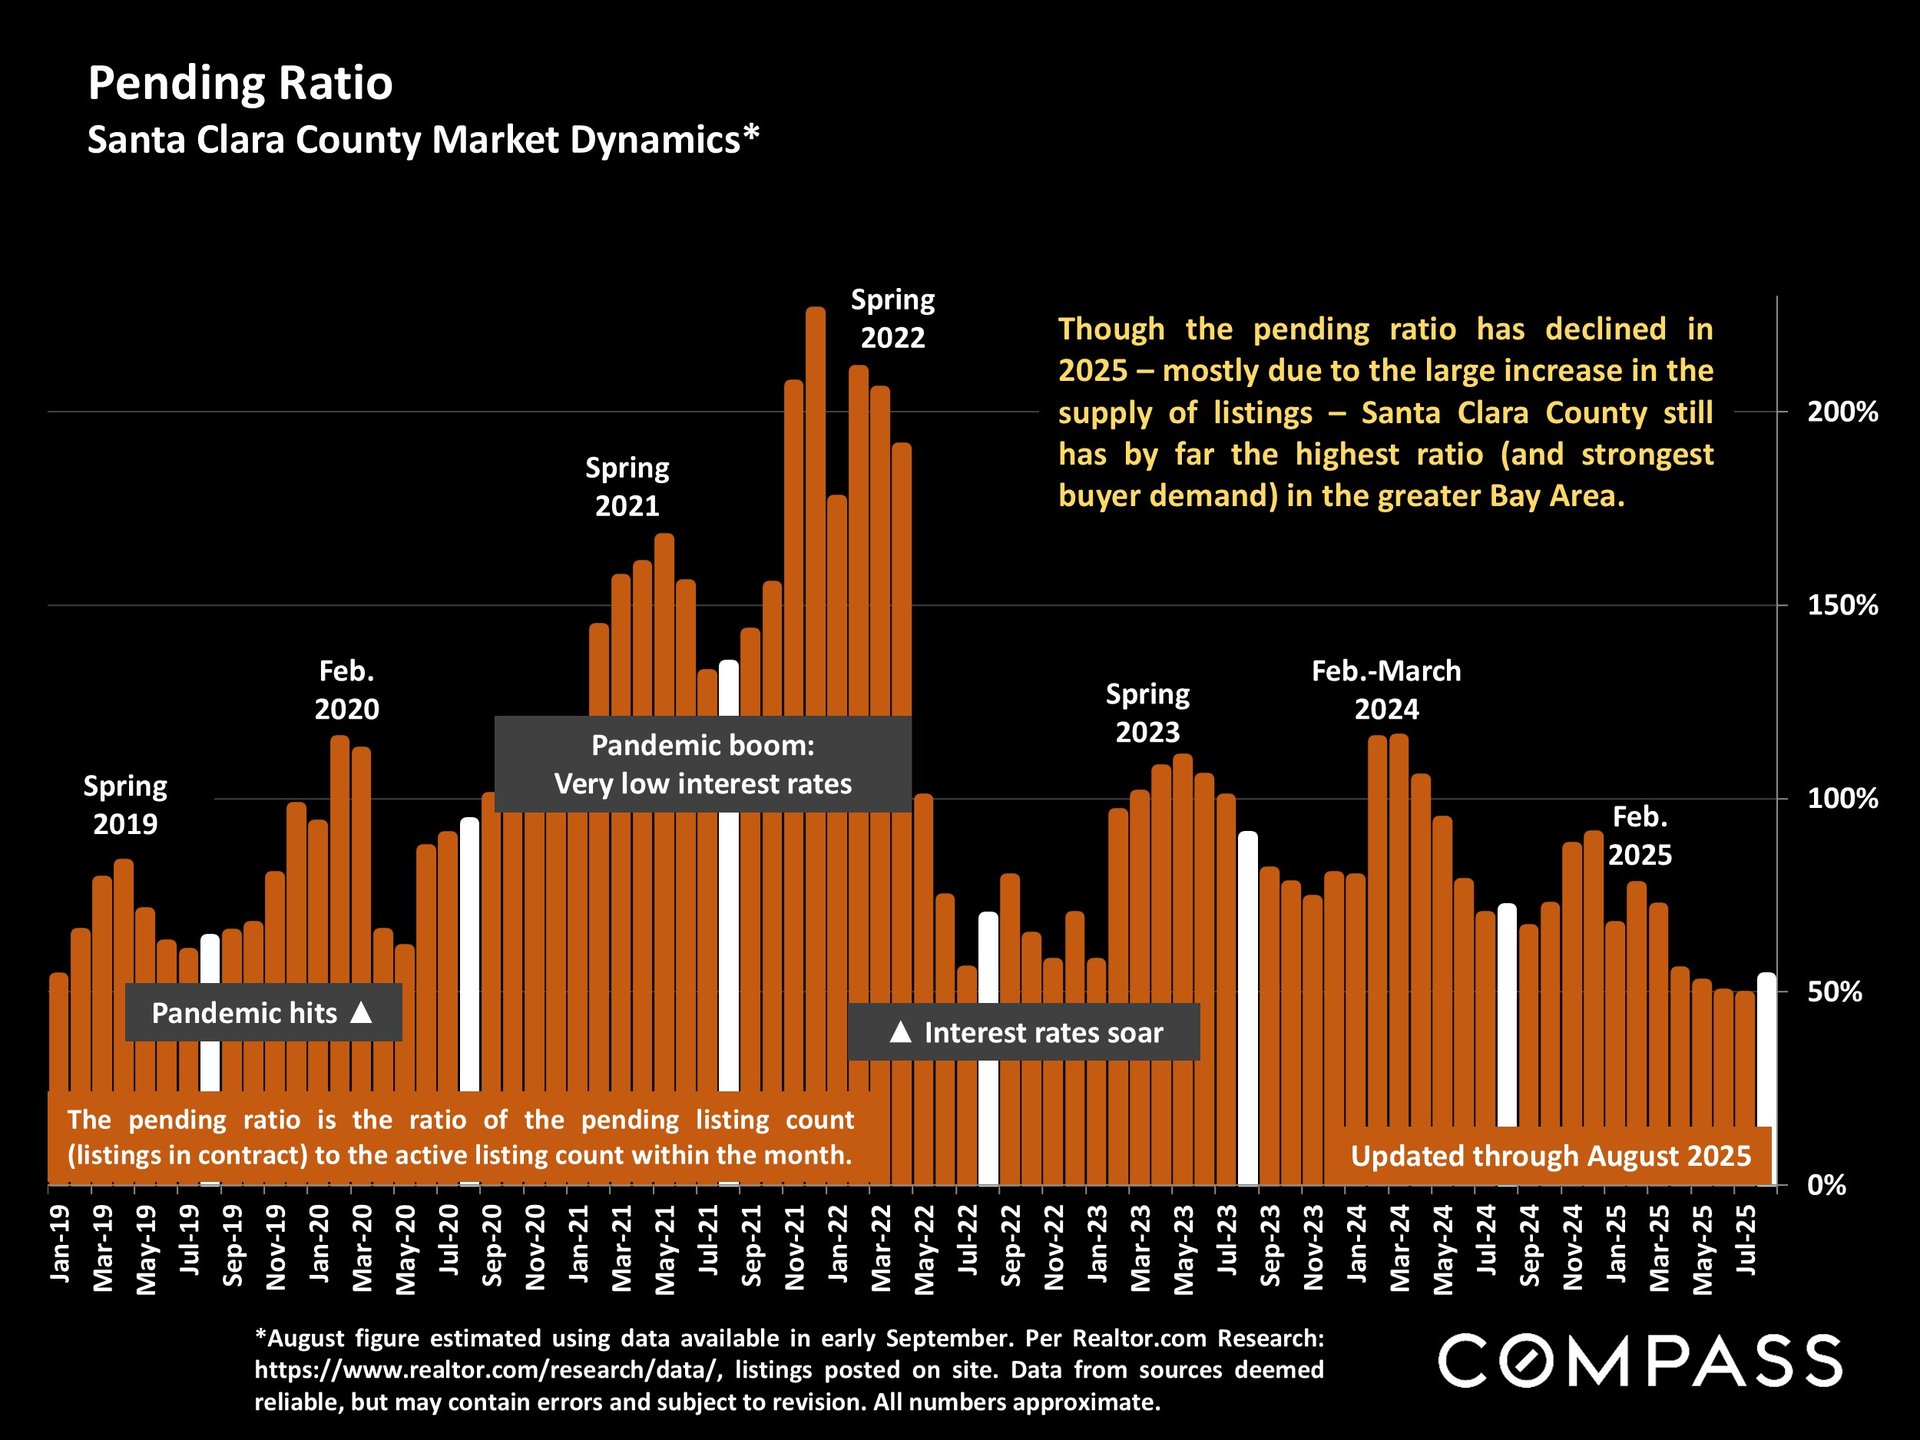
Overbidding decreased (from 67% to 46% in July; now 62% to 47%).
-
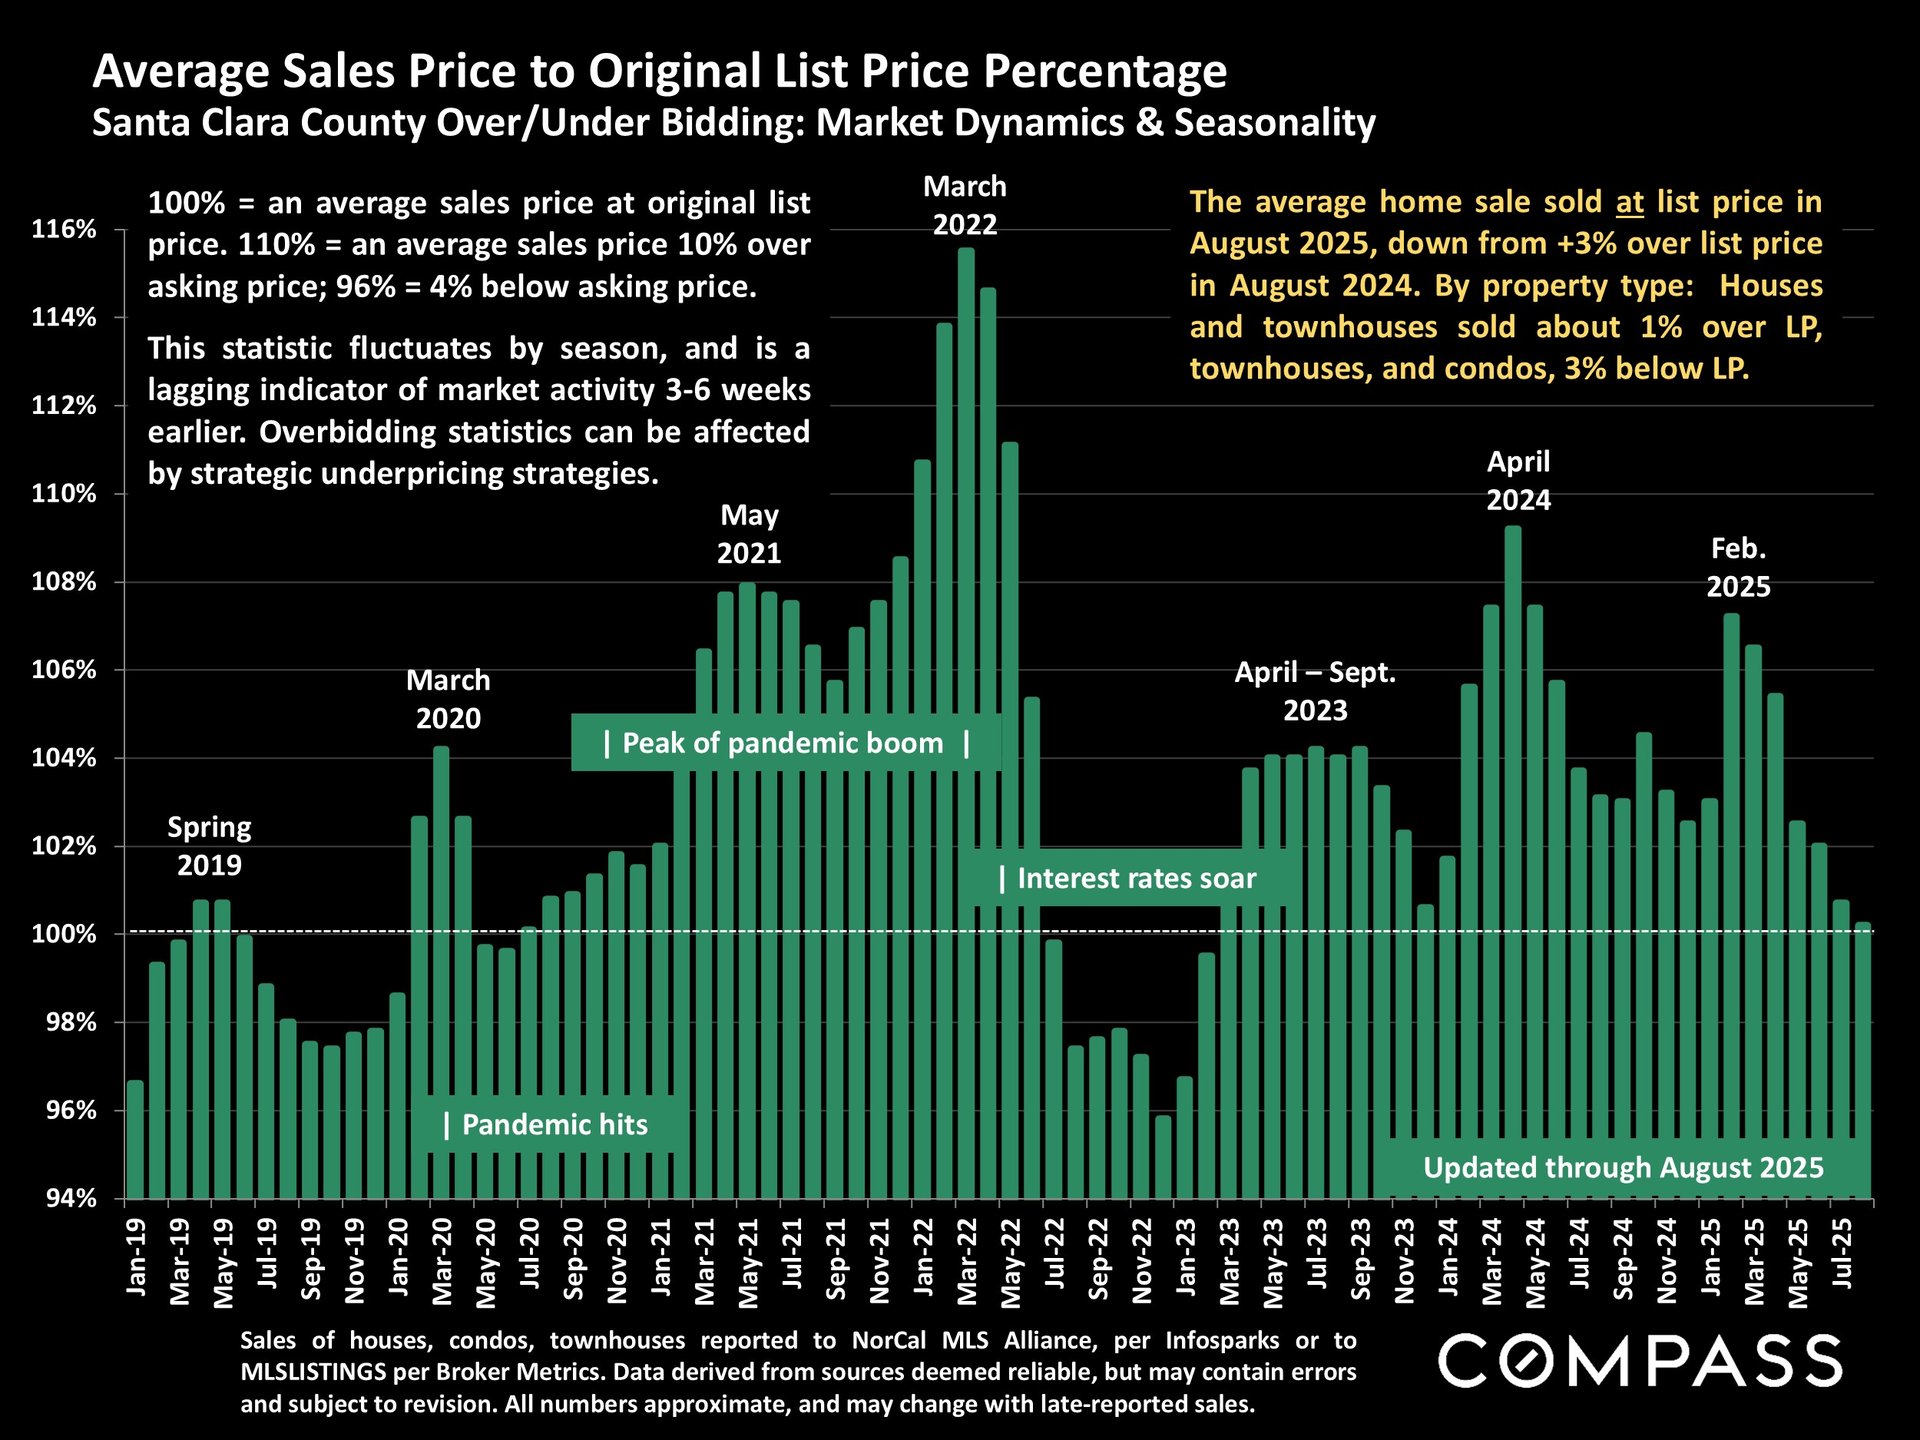
The sales price-to-list ratio slipped (from 104% to 99% in July; now from 103% to 100%).
-
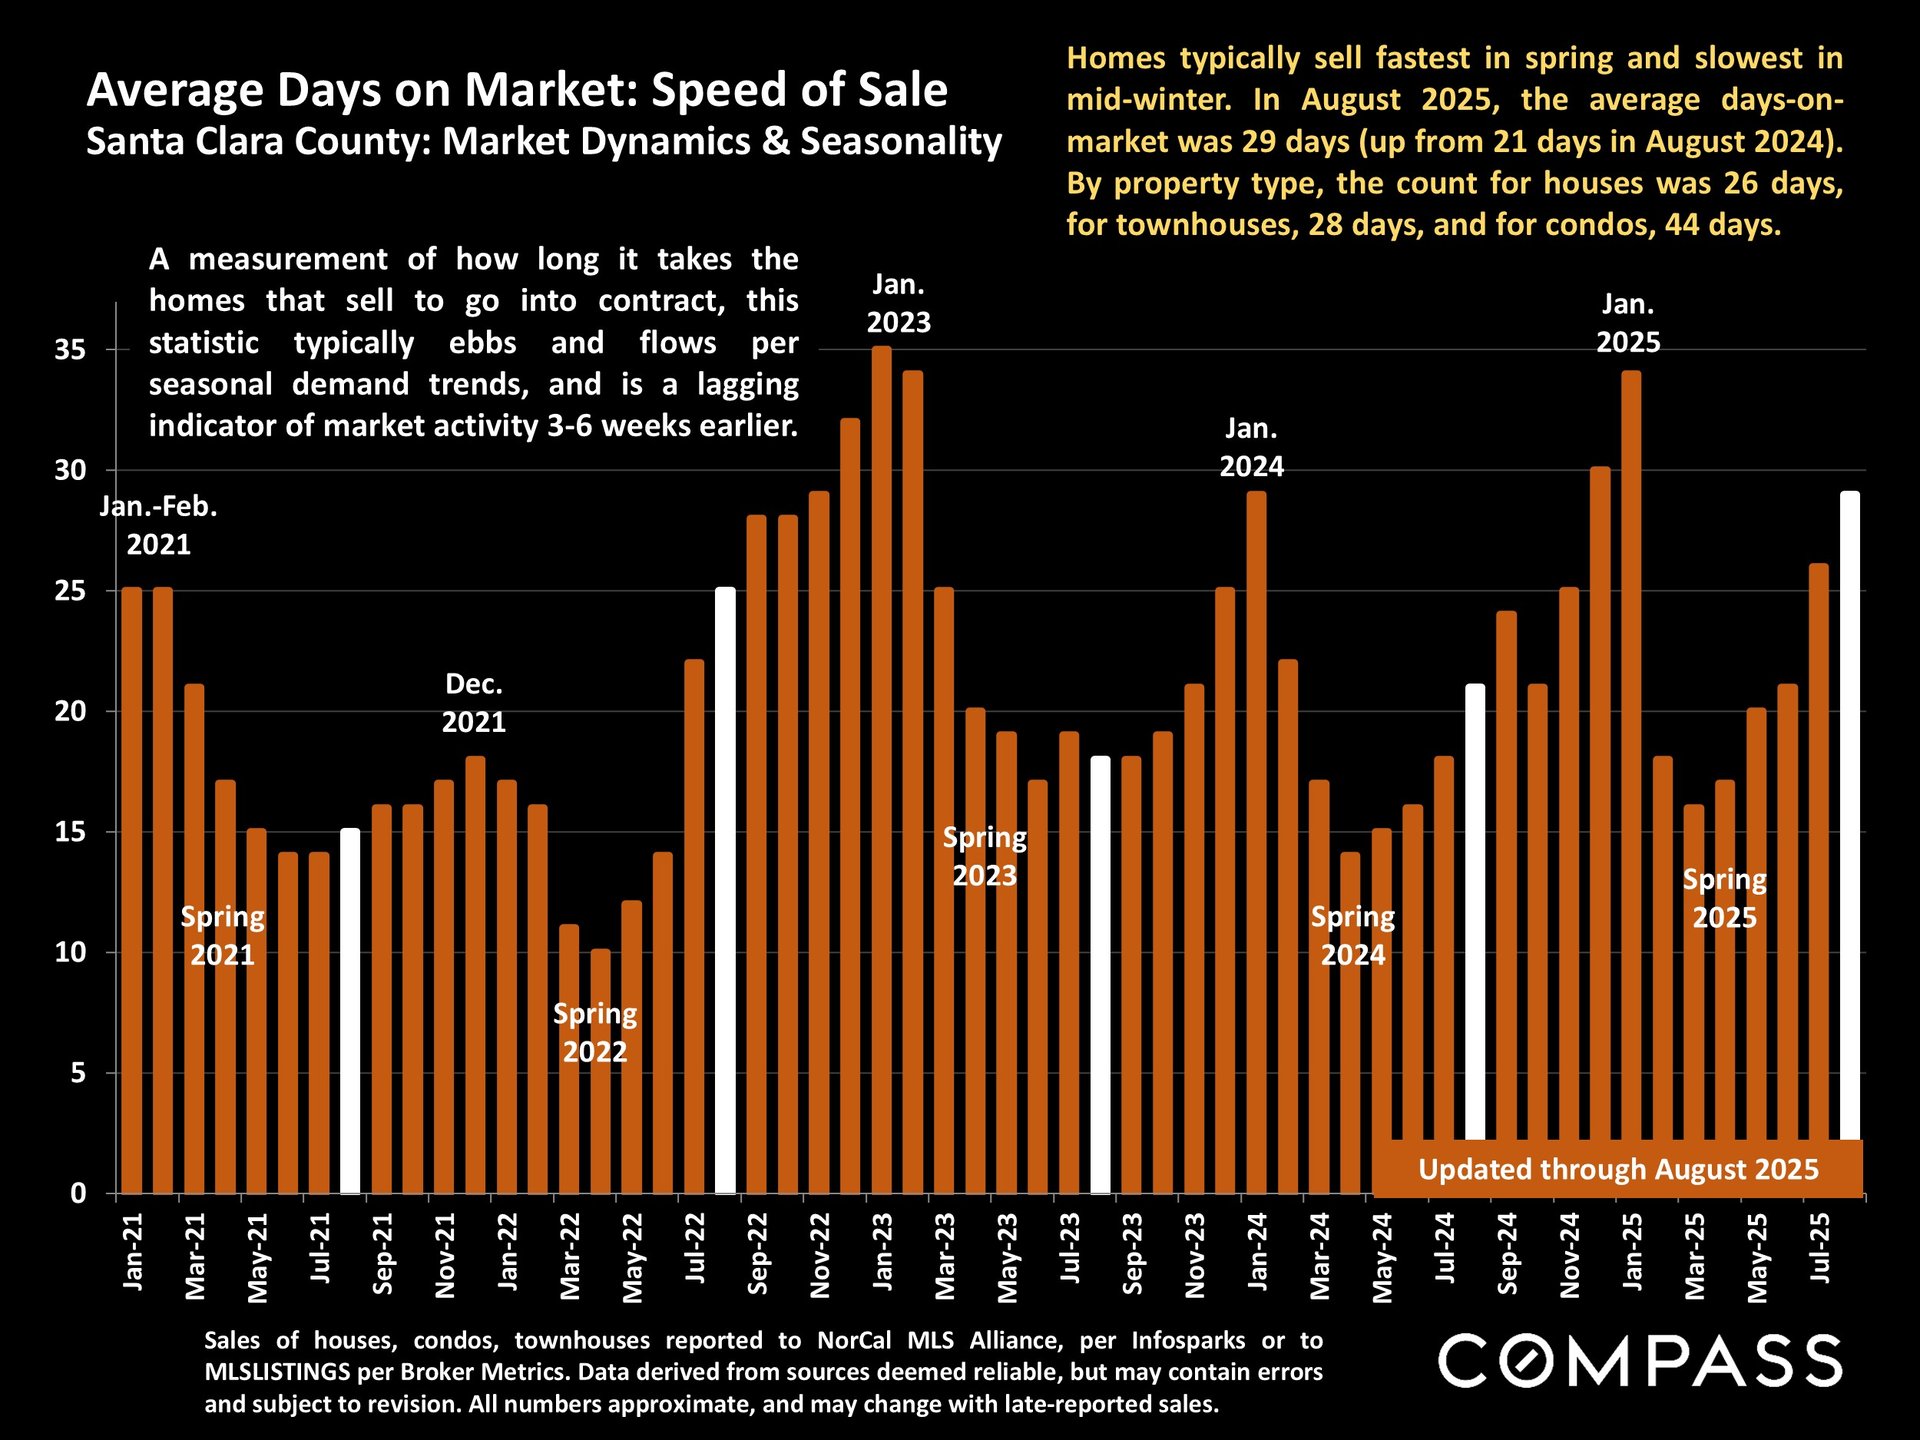
Days on market rose (18 → 25 in July; now 21 → 29).
📌 Conclusion: Even with rising inventory and longer selling times, Santa Clara remains the most competitive county, thanks to tech-driven demand and luxury sales strength.
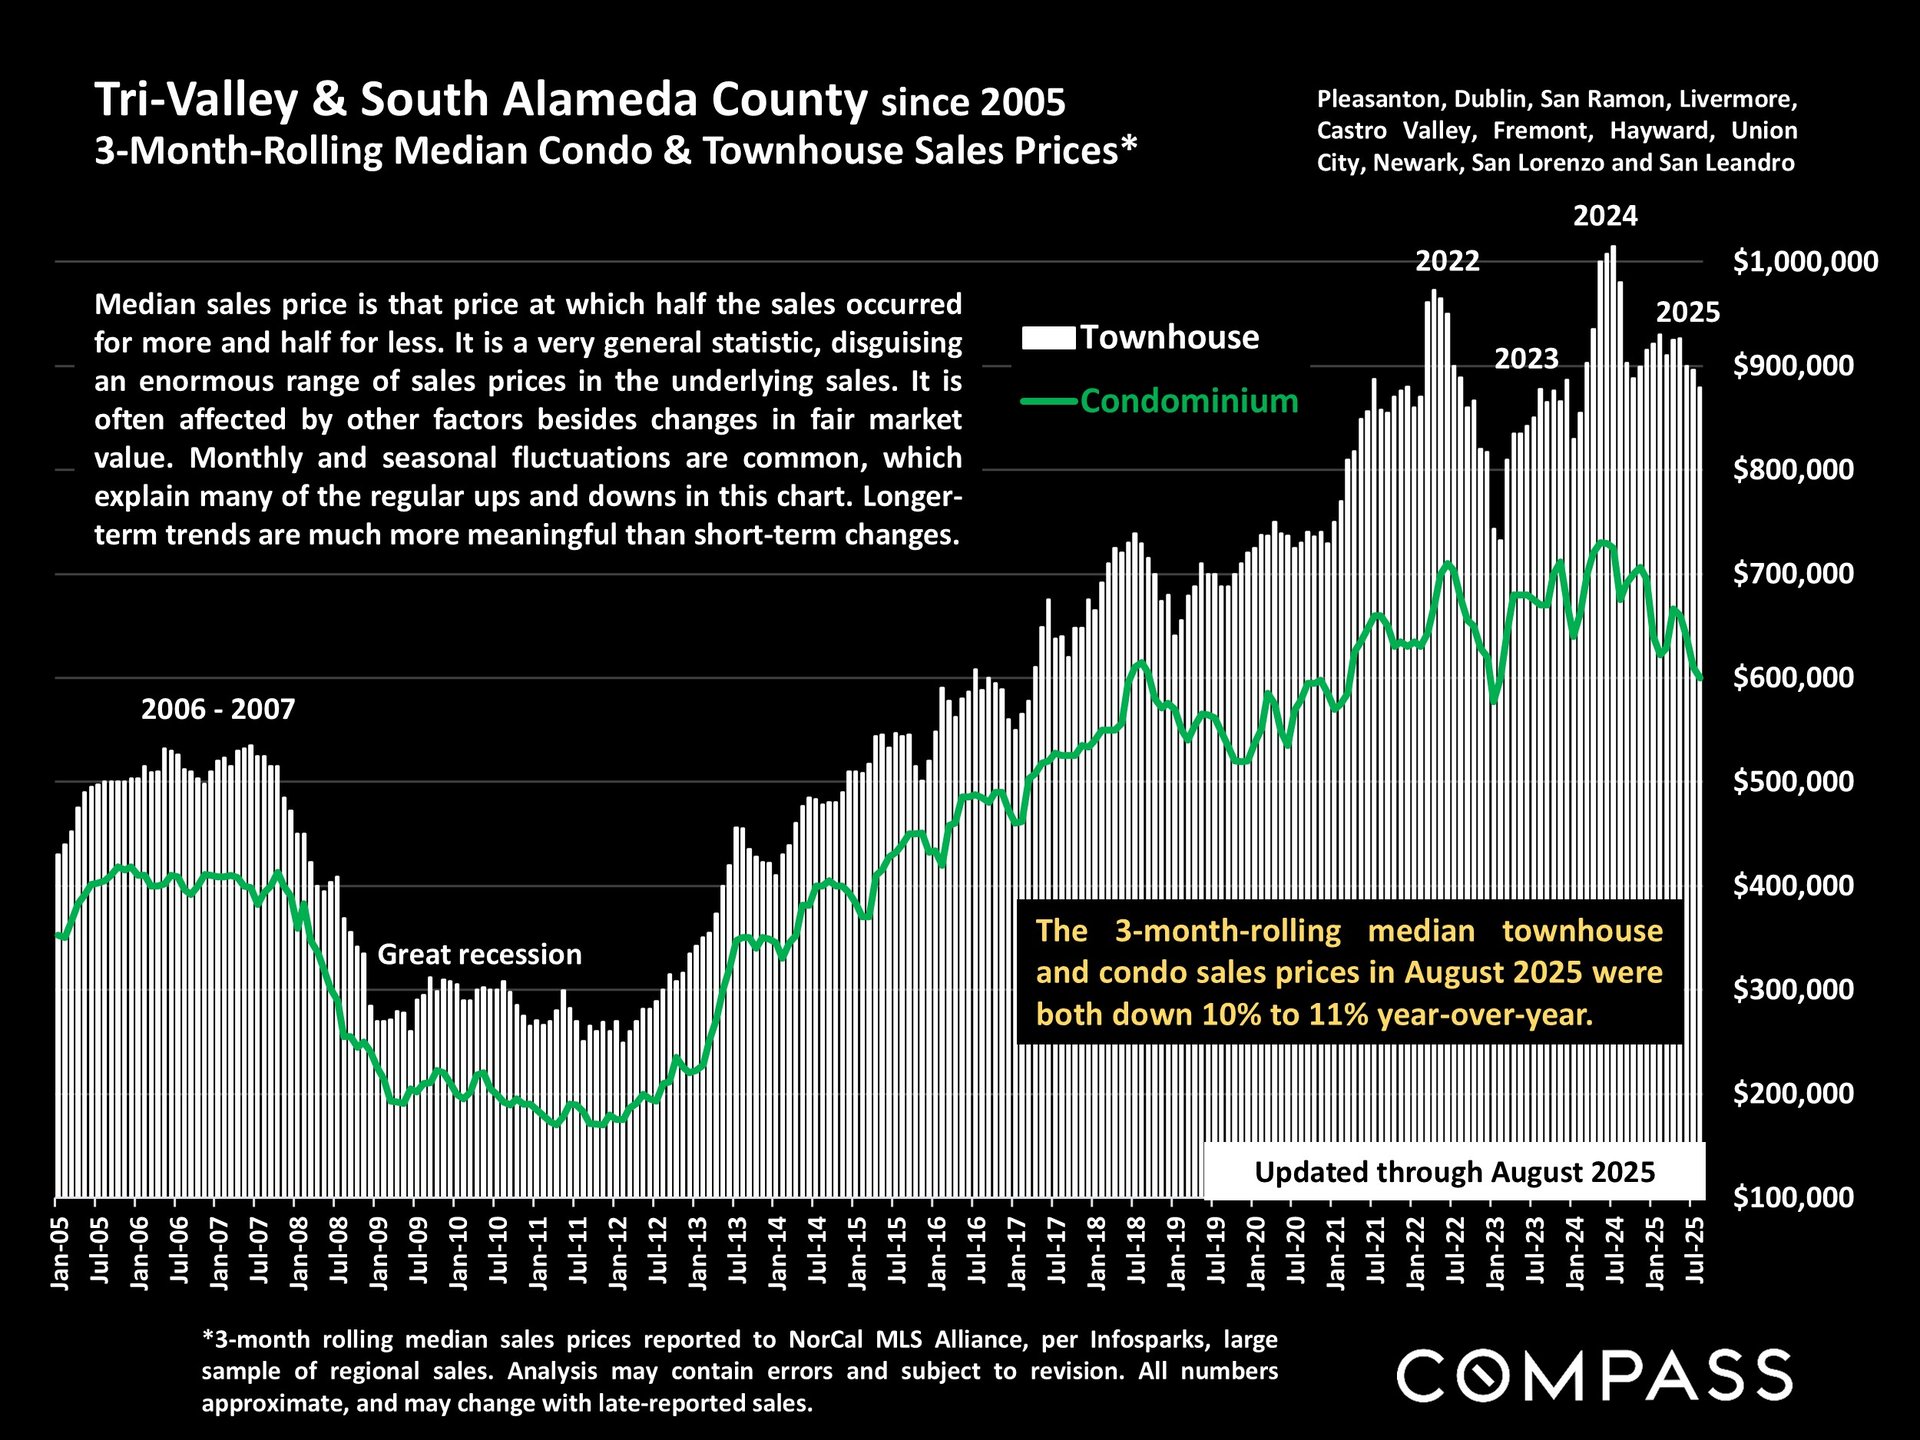
Alameda County
Alameda saw the steepest correction across both months:
-
Overbidding fell sharply (64% → 40% in July; now 60% → 39%).
-
Sales price-to-list ratio weakened (103% → 98.5% in July; now 102% → 99%).
-
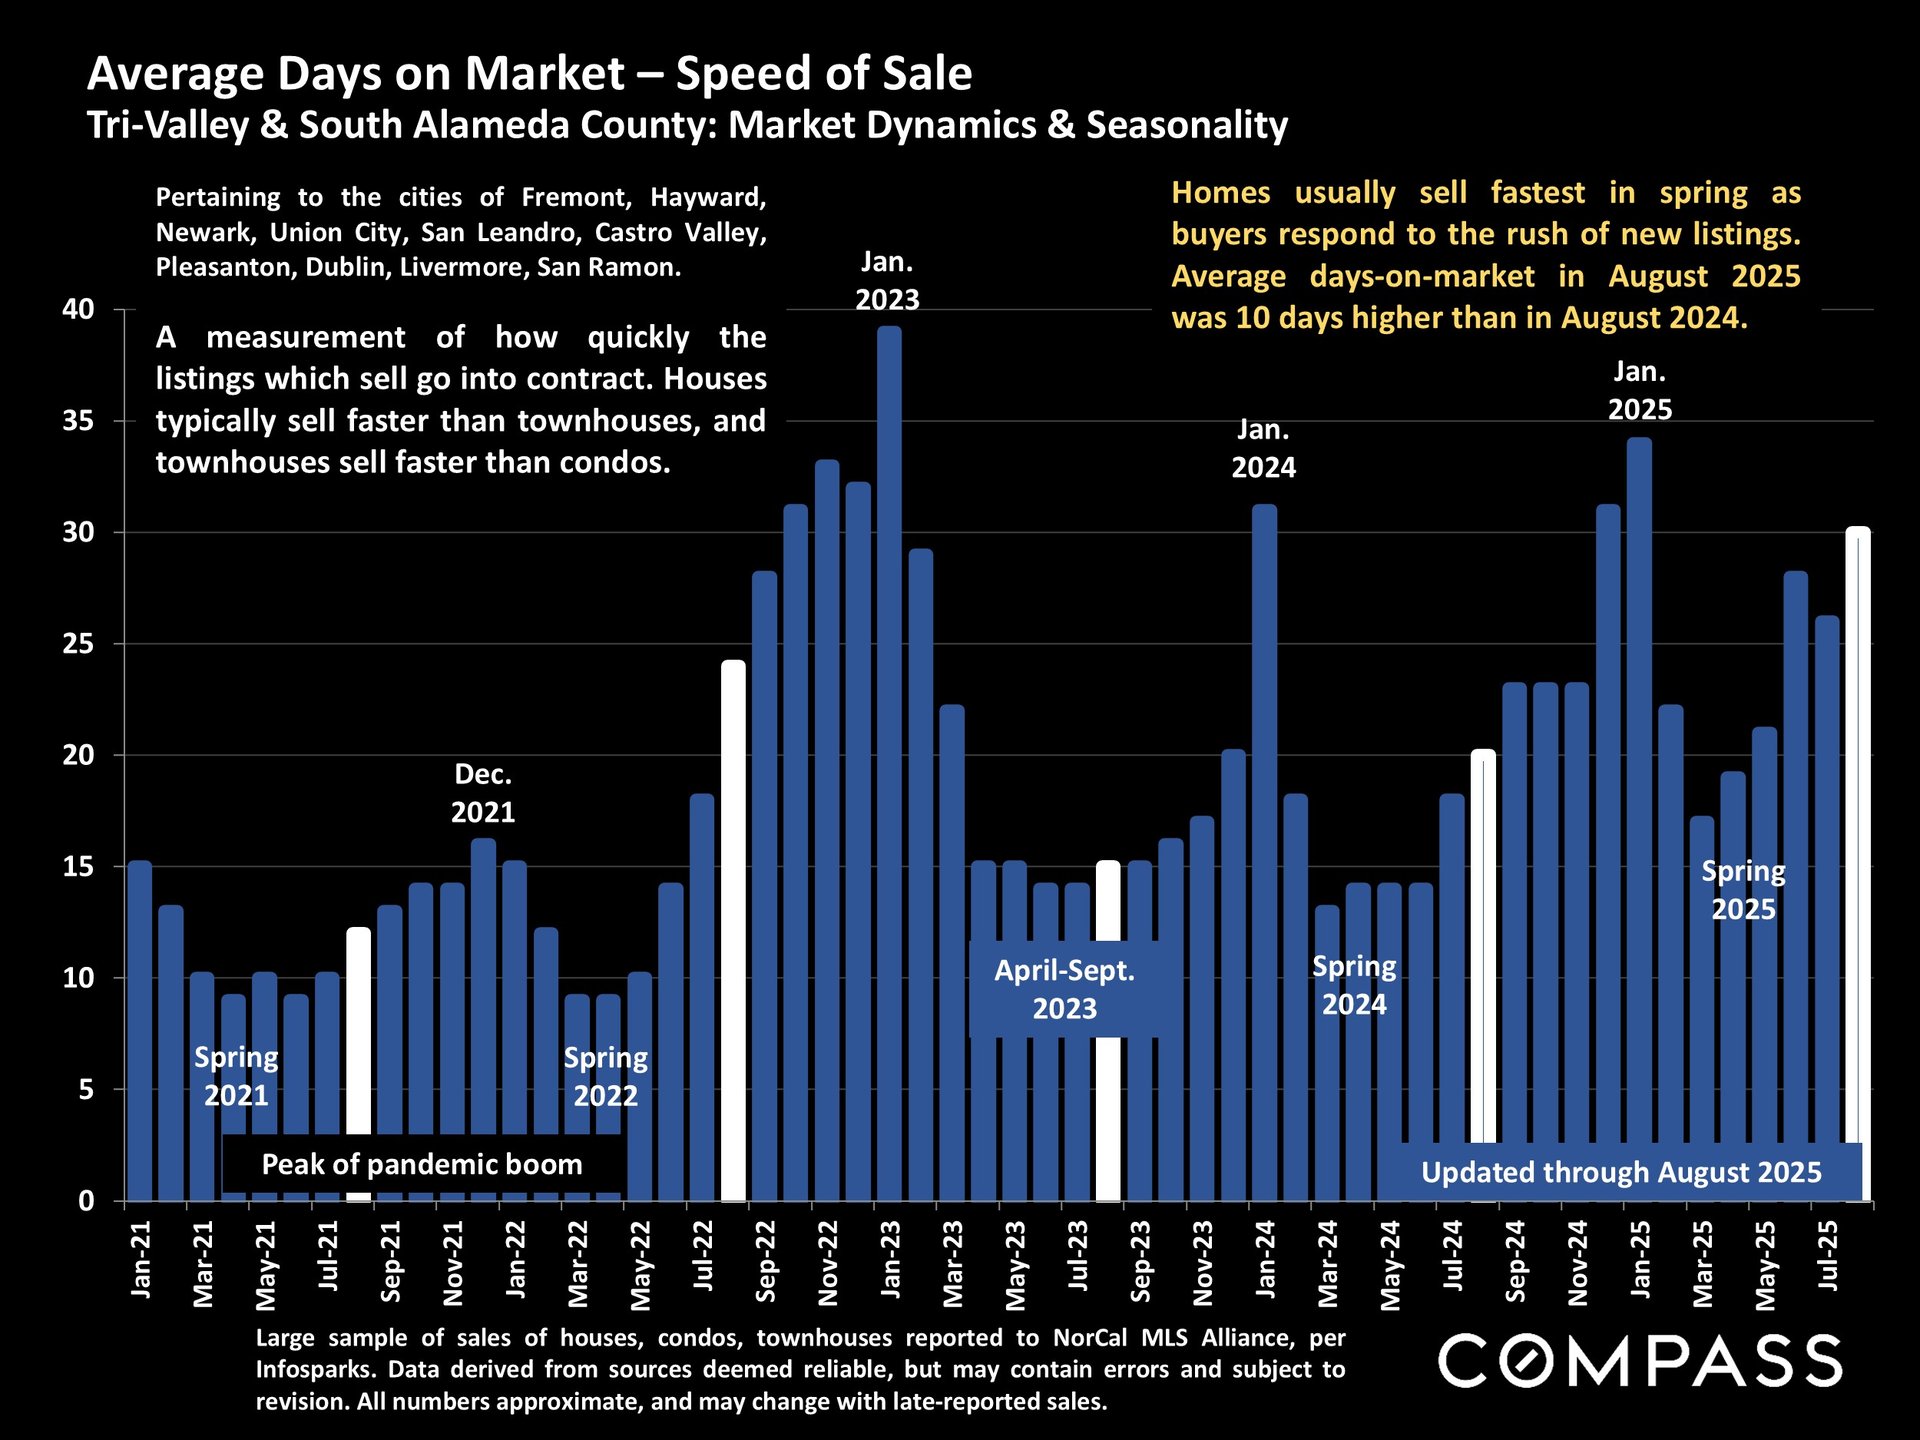
Days on market increased (15 → 23 in July; now 20 → 27).
📌 Conclusion: Alameda shows the fastest cooling, especially in condos/townhomes (–10% to –11% YOY). Still, relative affordability draws steady buyer interest in Fremont, Dublin, and Pleasanton.
Bay Area Conclusion
Between July and August 2025, the Bay Area overall continued its cooling trend:
-
Overbidding dropped across all counties.
-
Sales-to-list ratios converged closer to 100%.
-
Days on market extended another week.
📌 Final Takeaway: The Bay Area is shifting from a frenzied seller’s market into a more balanced environment. Buyers now enjoy more leverage, while sellers must adjust expectations with realistic pricing. Long-term, though, appreciation remains robust. San Mateo and Santa Clara have nearly doubled values since 2014, proving the resilience of core Bay Area markets.
Short-Term Appreciation (August 2025 vs. August 2024)
-
San Mateo: –2% for single-family homes; –5% for condos/townhomes.
-
Santa Clara: +2% for single-family homes; –5% for condos/townhomes.
-
Alameda: –10% for single-family homes; –11% for condos/townhomes.
Long-Term Appreciation (2014 → 2025)
-
San Mateo: +75% for single-family homes; +59% for condos/townhomes.
-
Santa Clara: +90% for single-family homes; +61% for condos/townhomes.
-
Alameda: +67% for single-family homes; +50% for condos/townhomes.
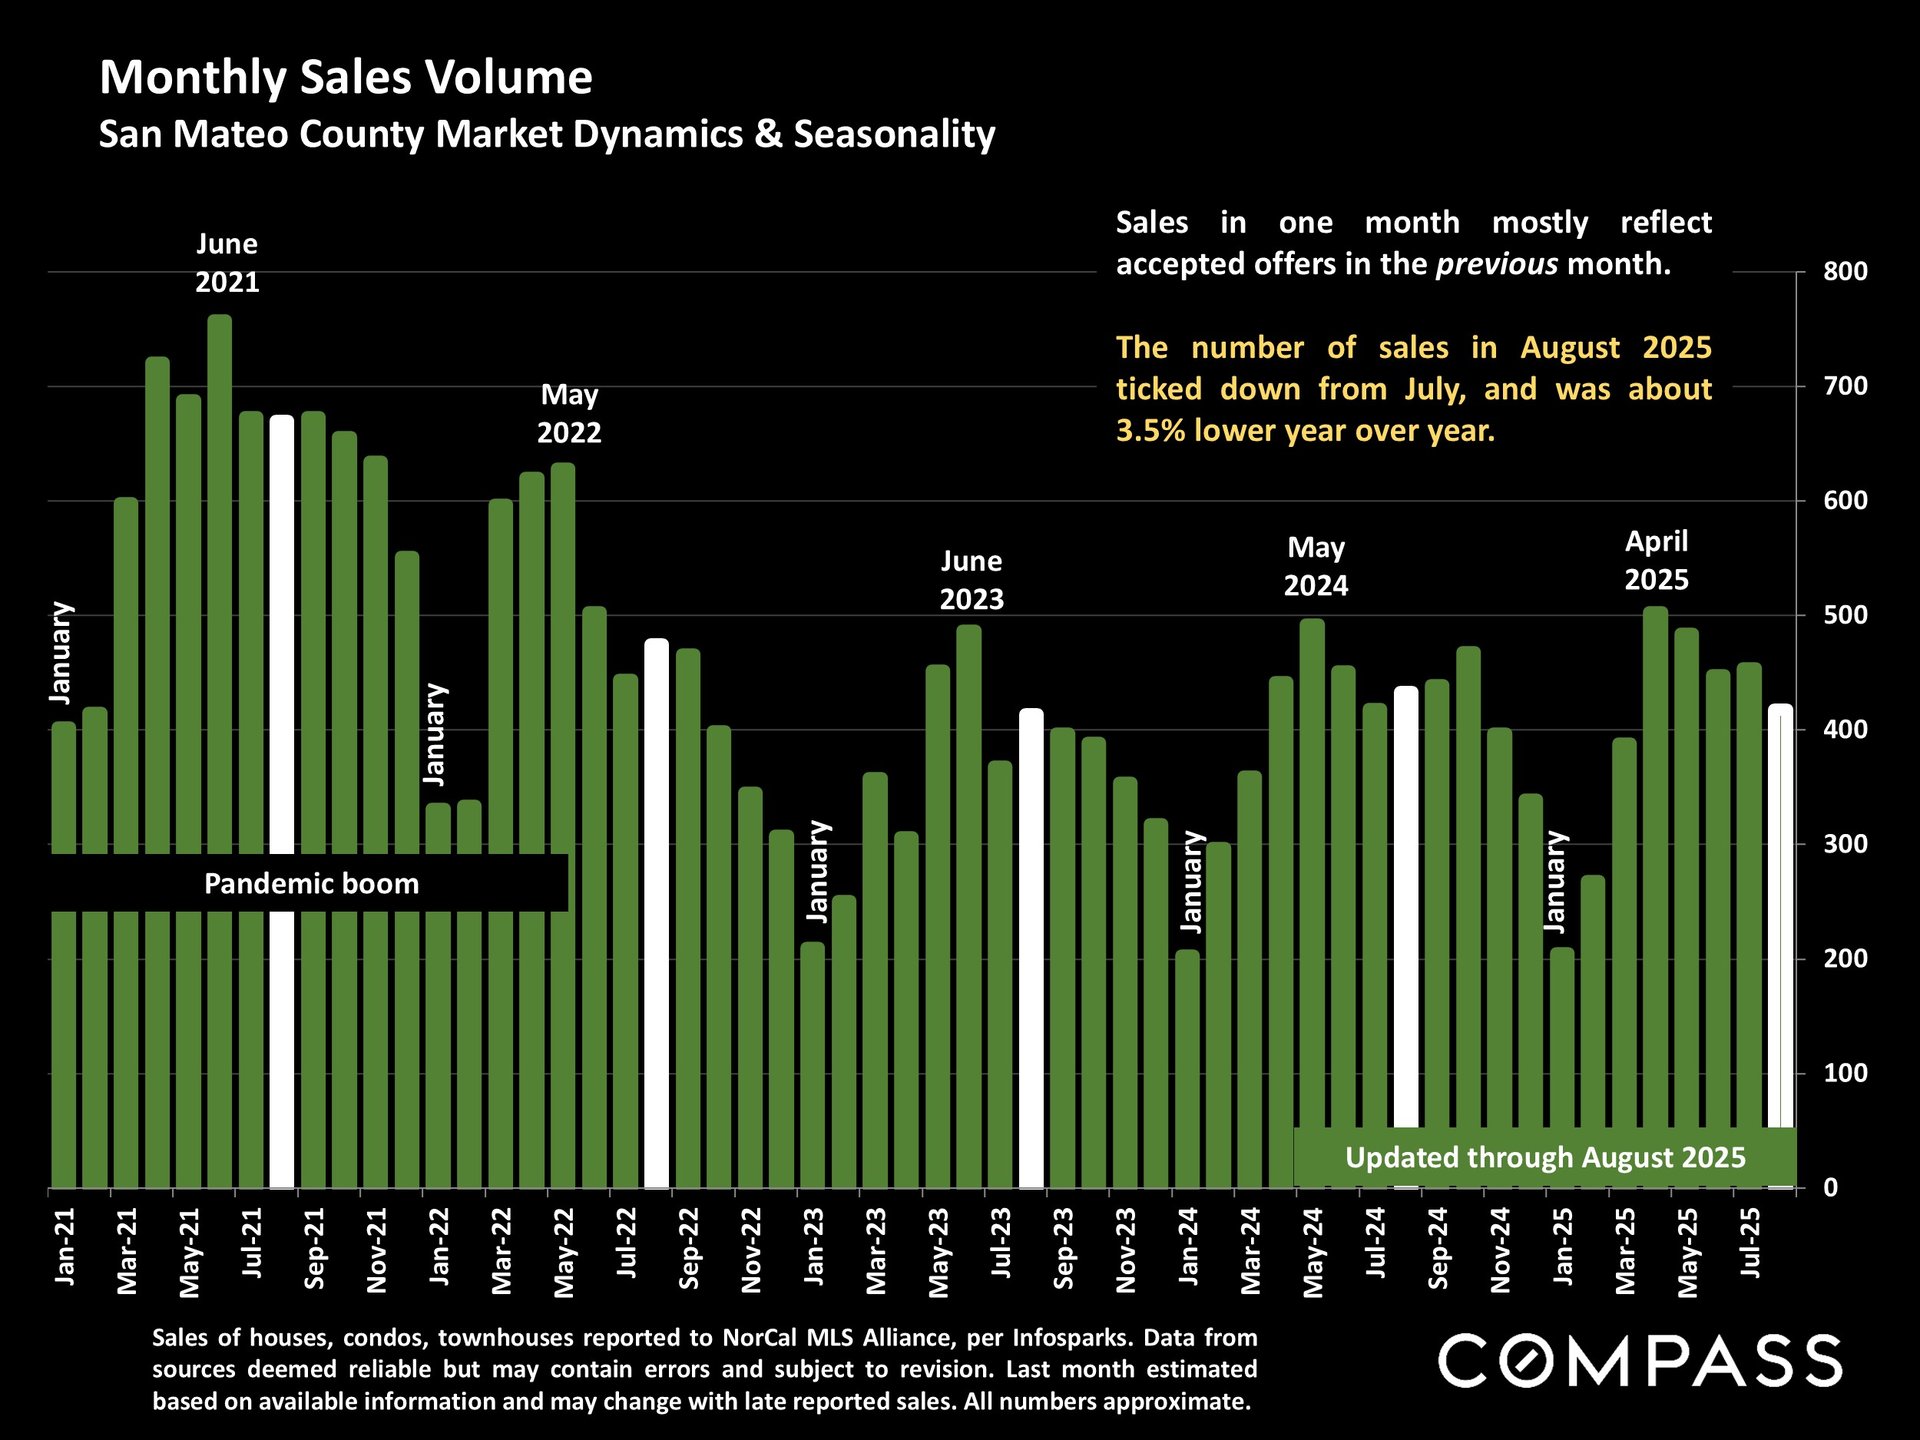
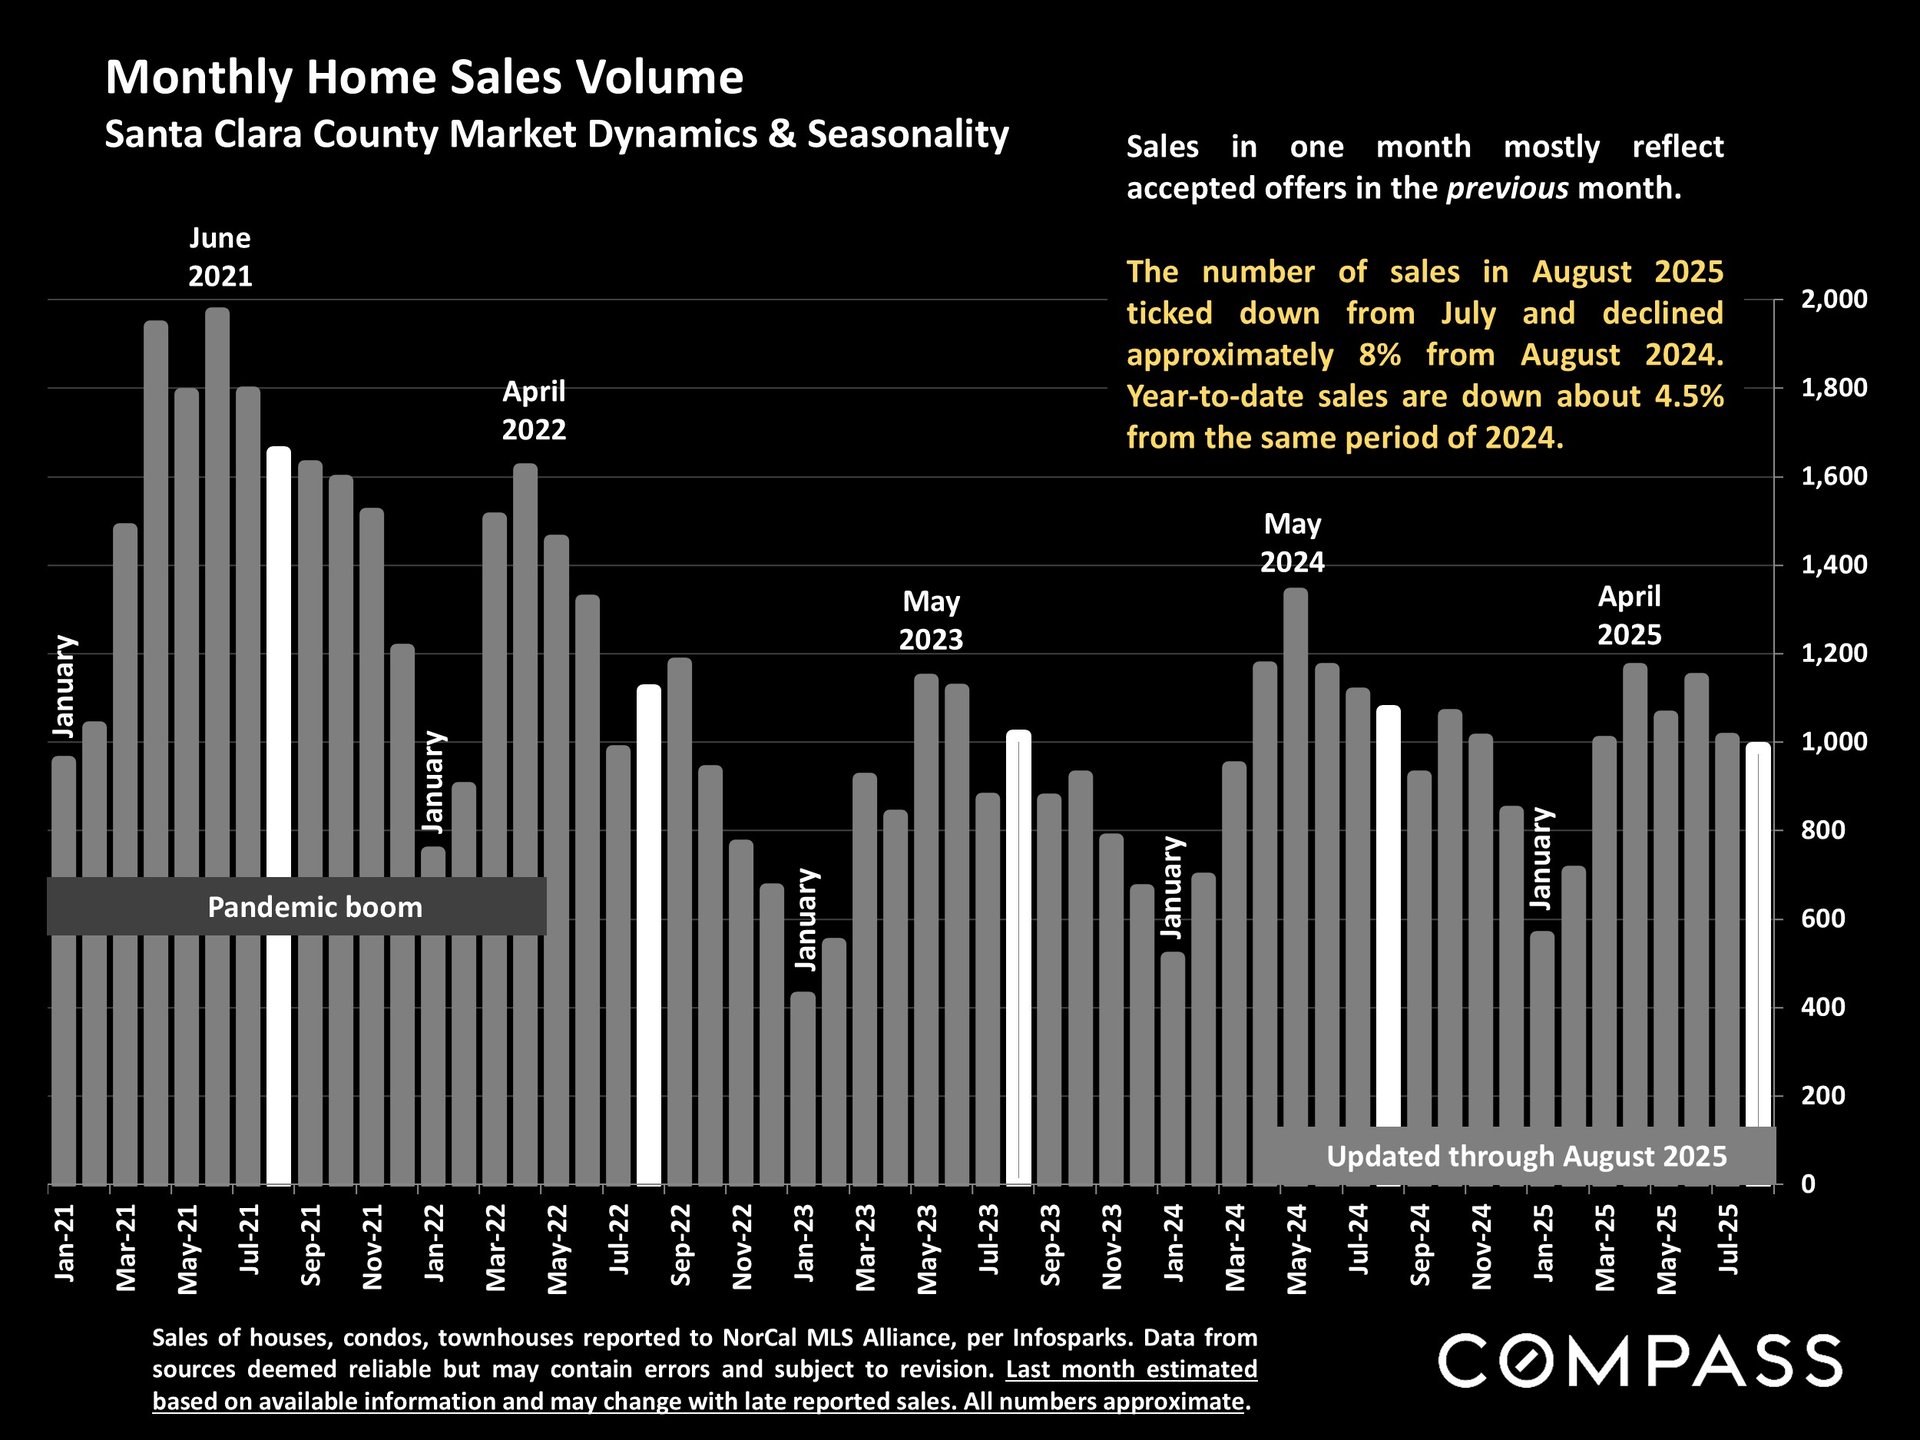
Sales Volume (August 2025 vs. August 2024)
-
San Mateo: –3.5% closed sales.
-
Santa Clara: –8% closed sales.
-
Alameda: –10% closed sales.
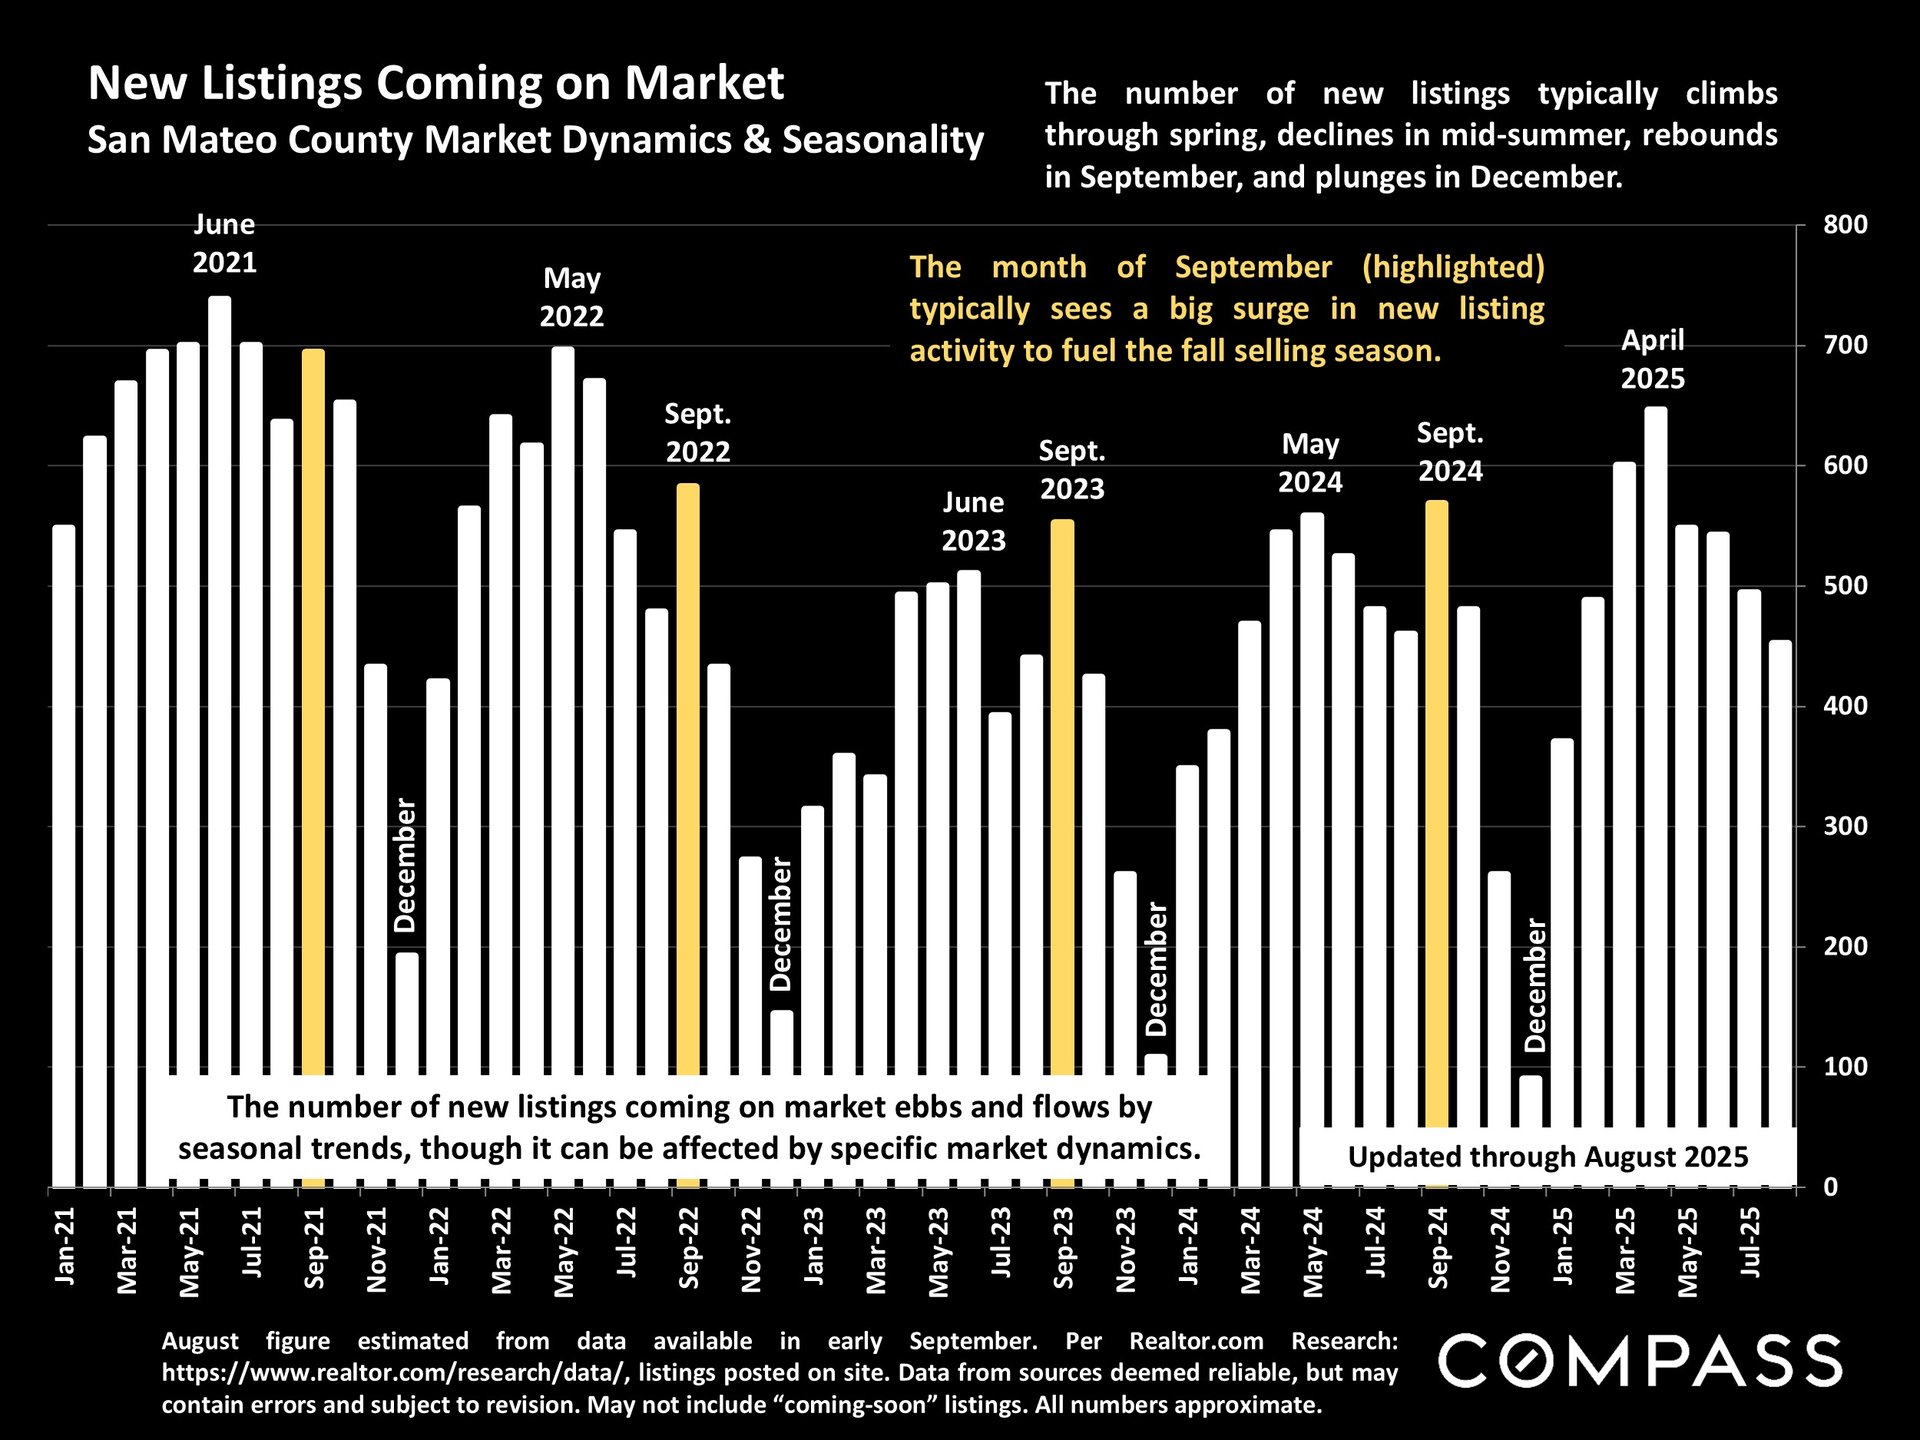
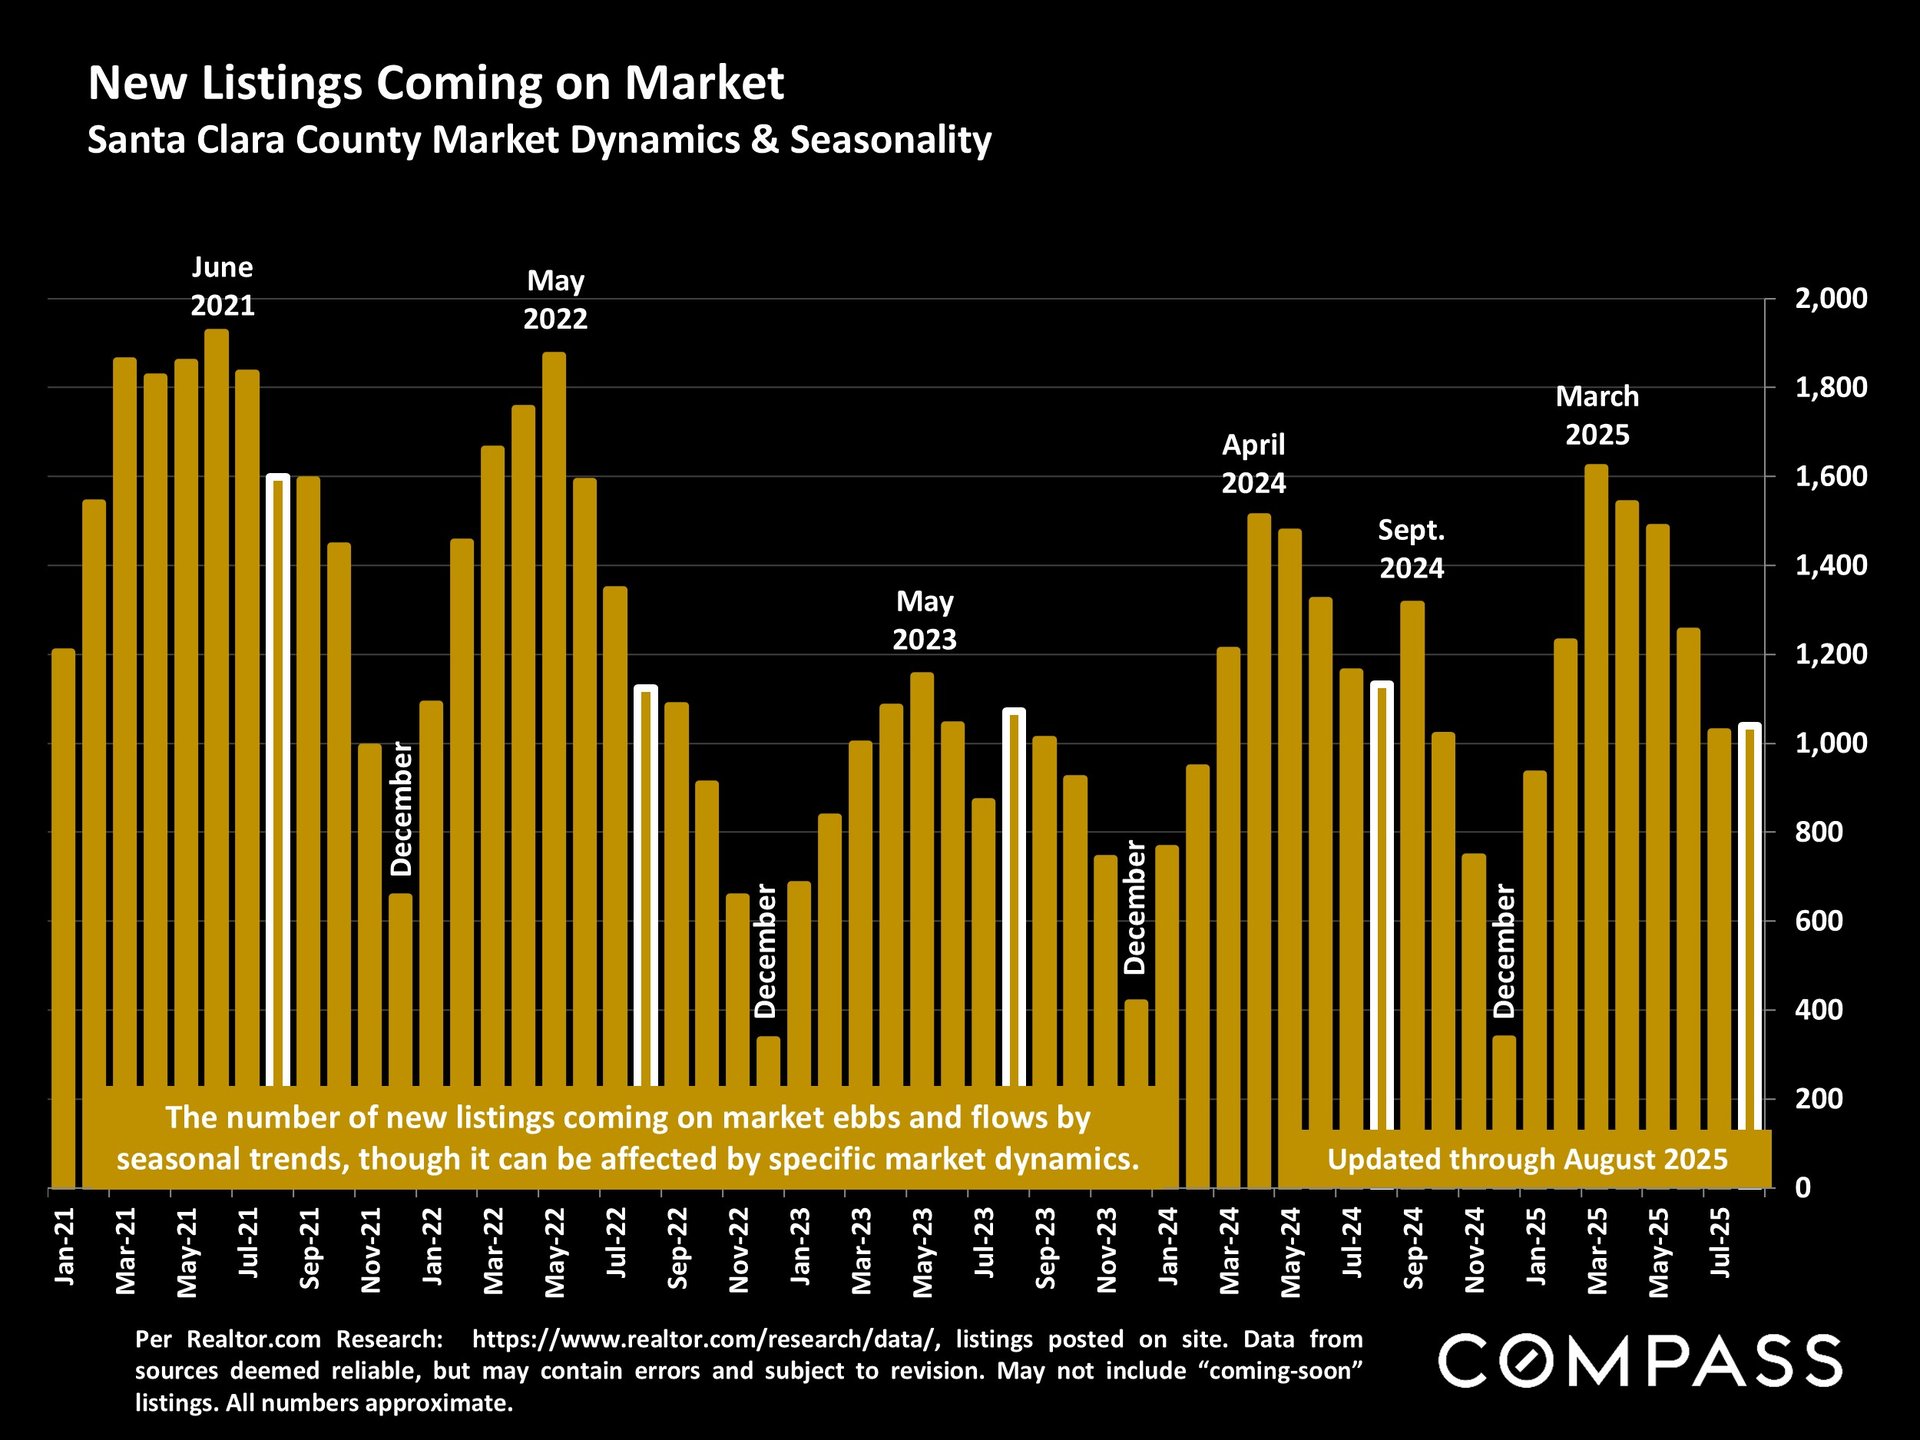
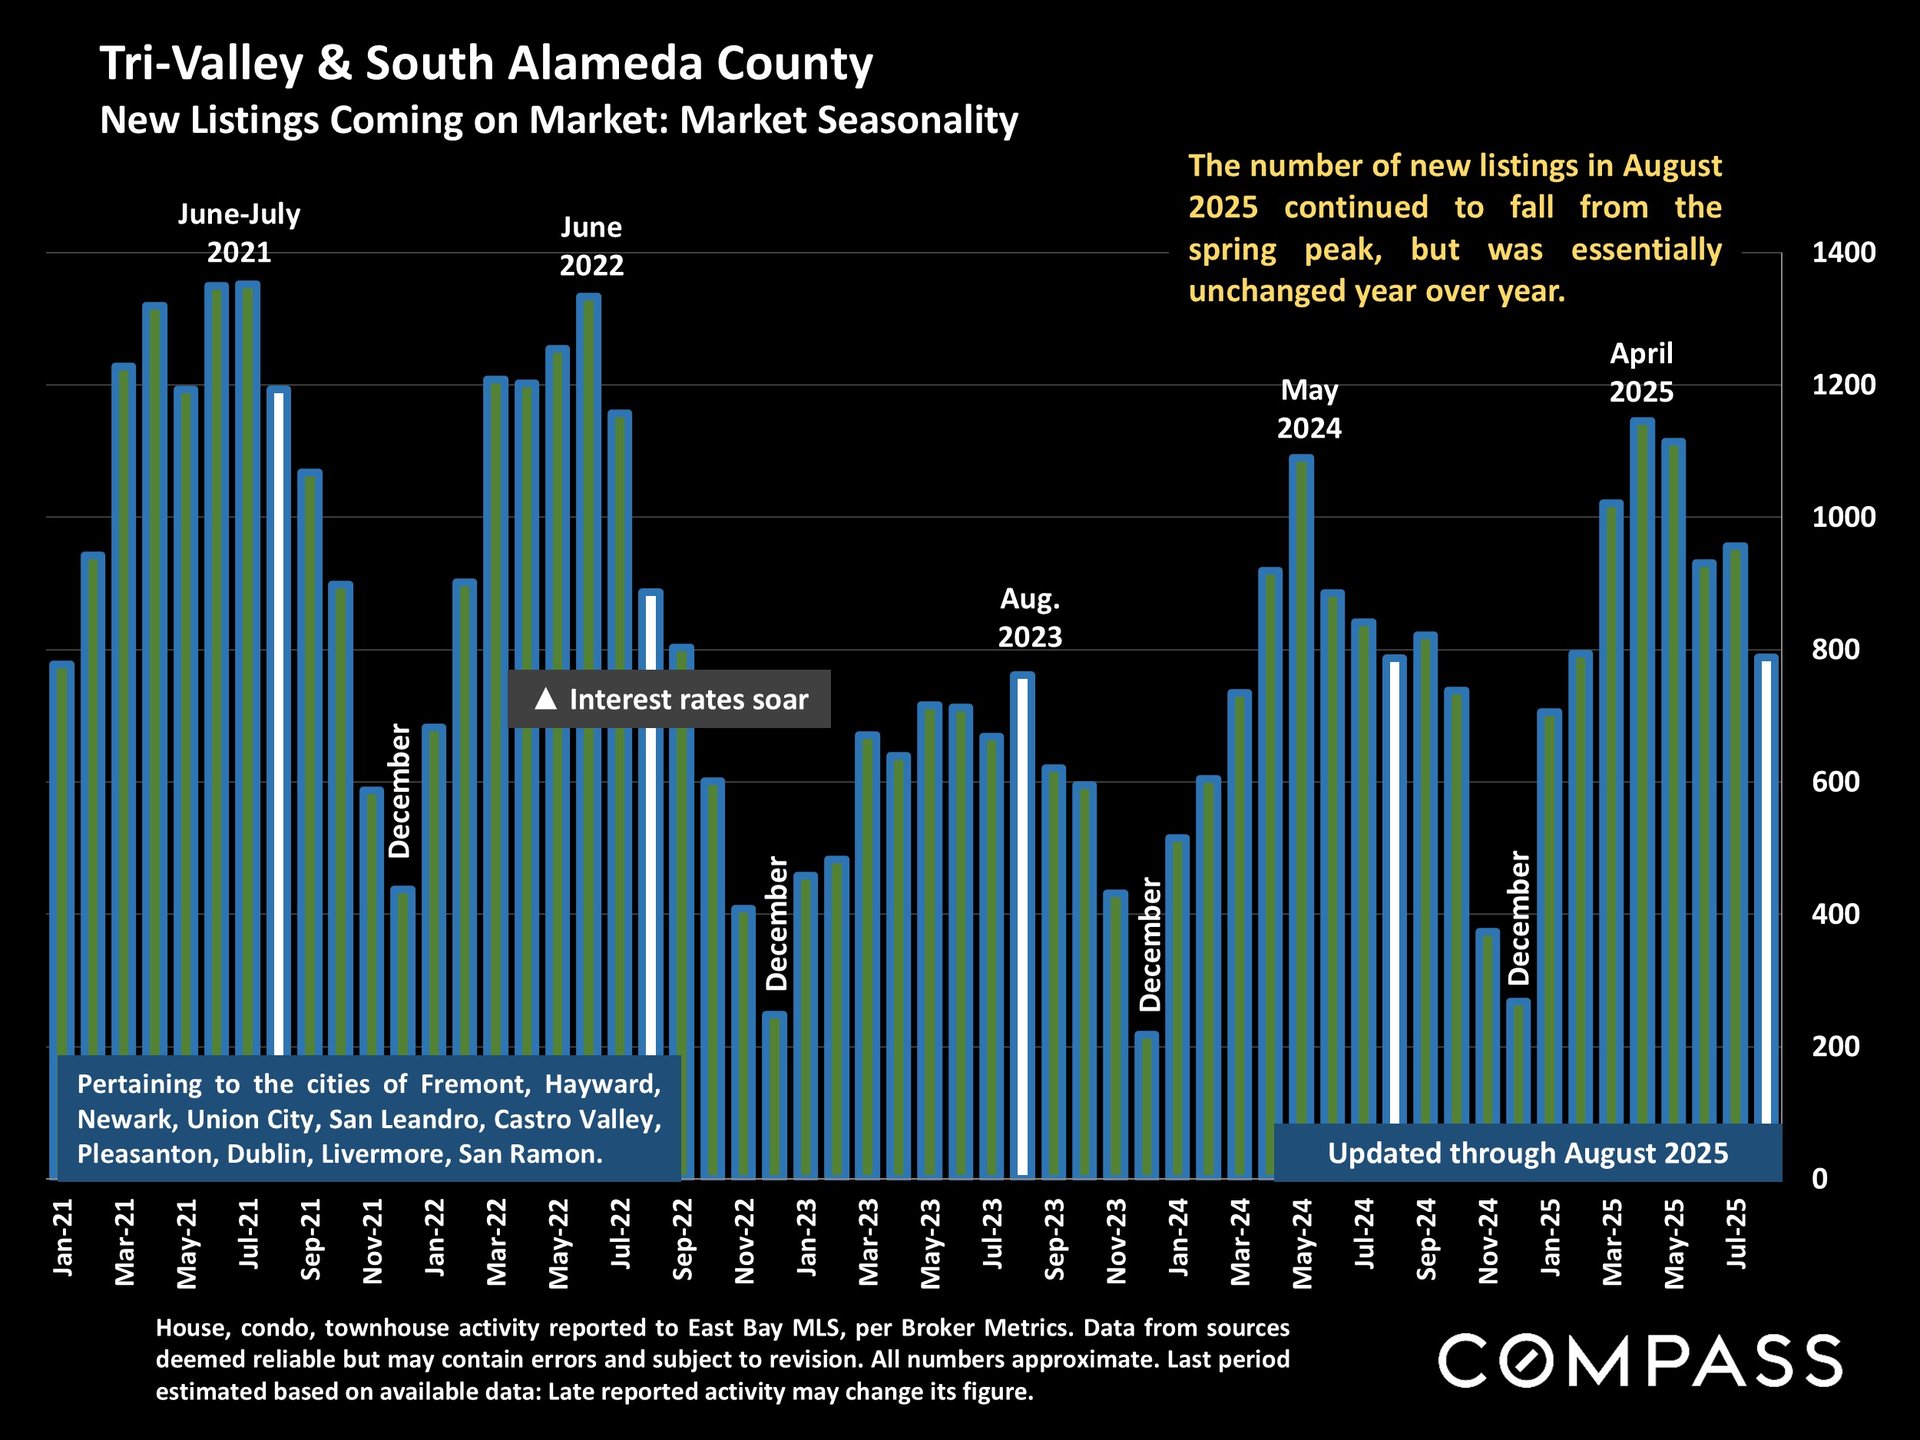
New Listings (August 2025 vs. August 2024)
-
San Mateo: +7%.
-
Santa Clara: +9%.
-
Alameda: +11%.
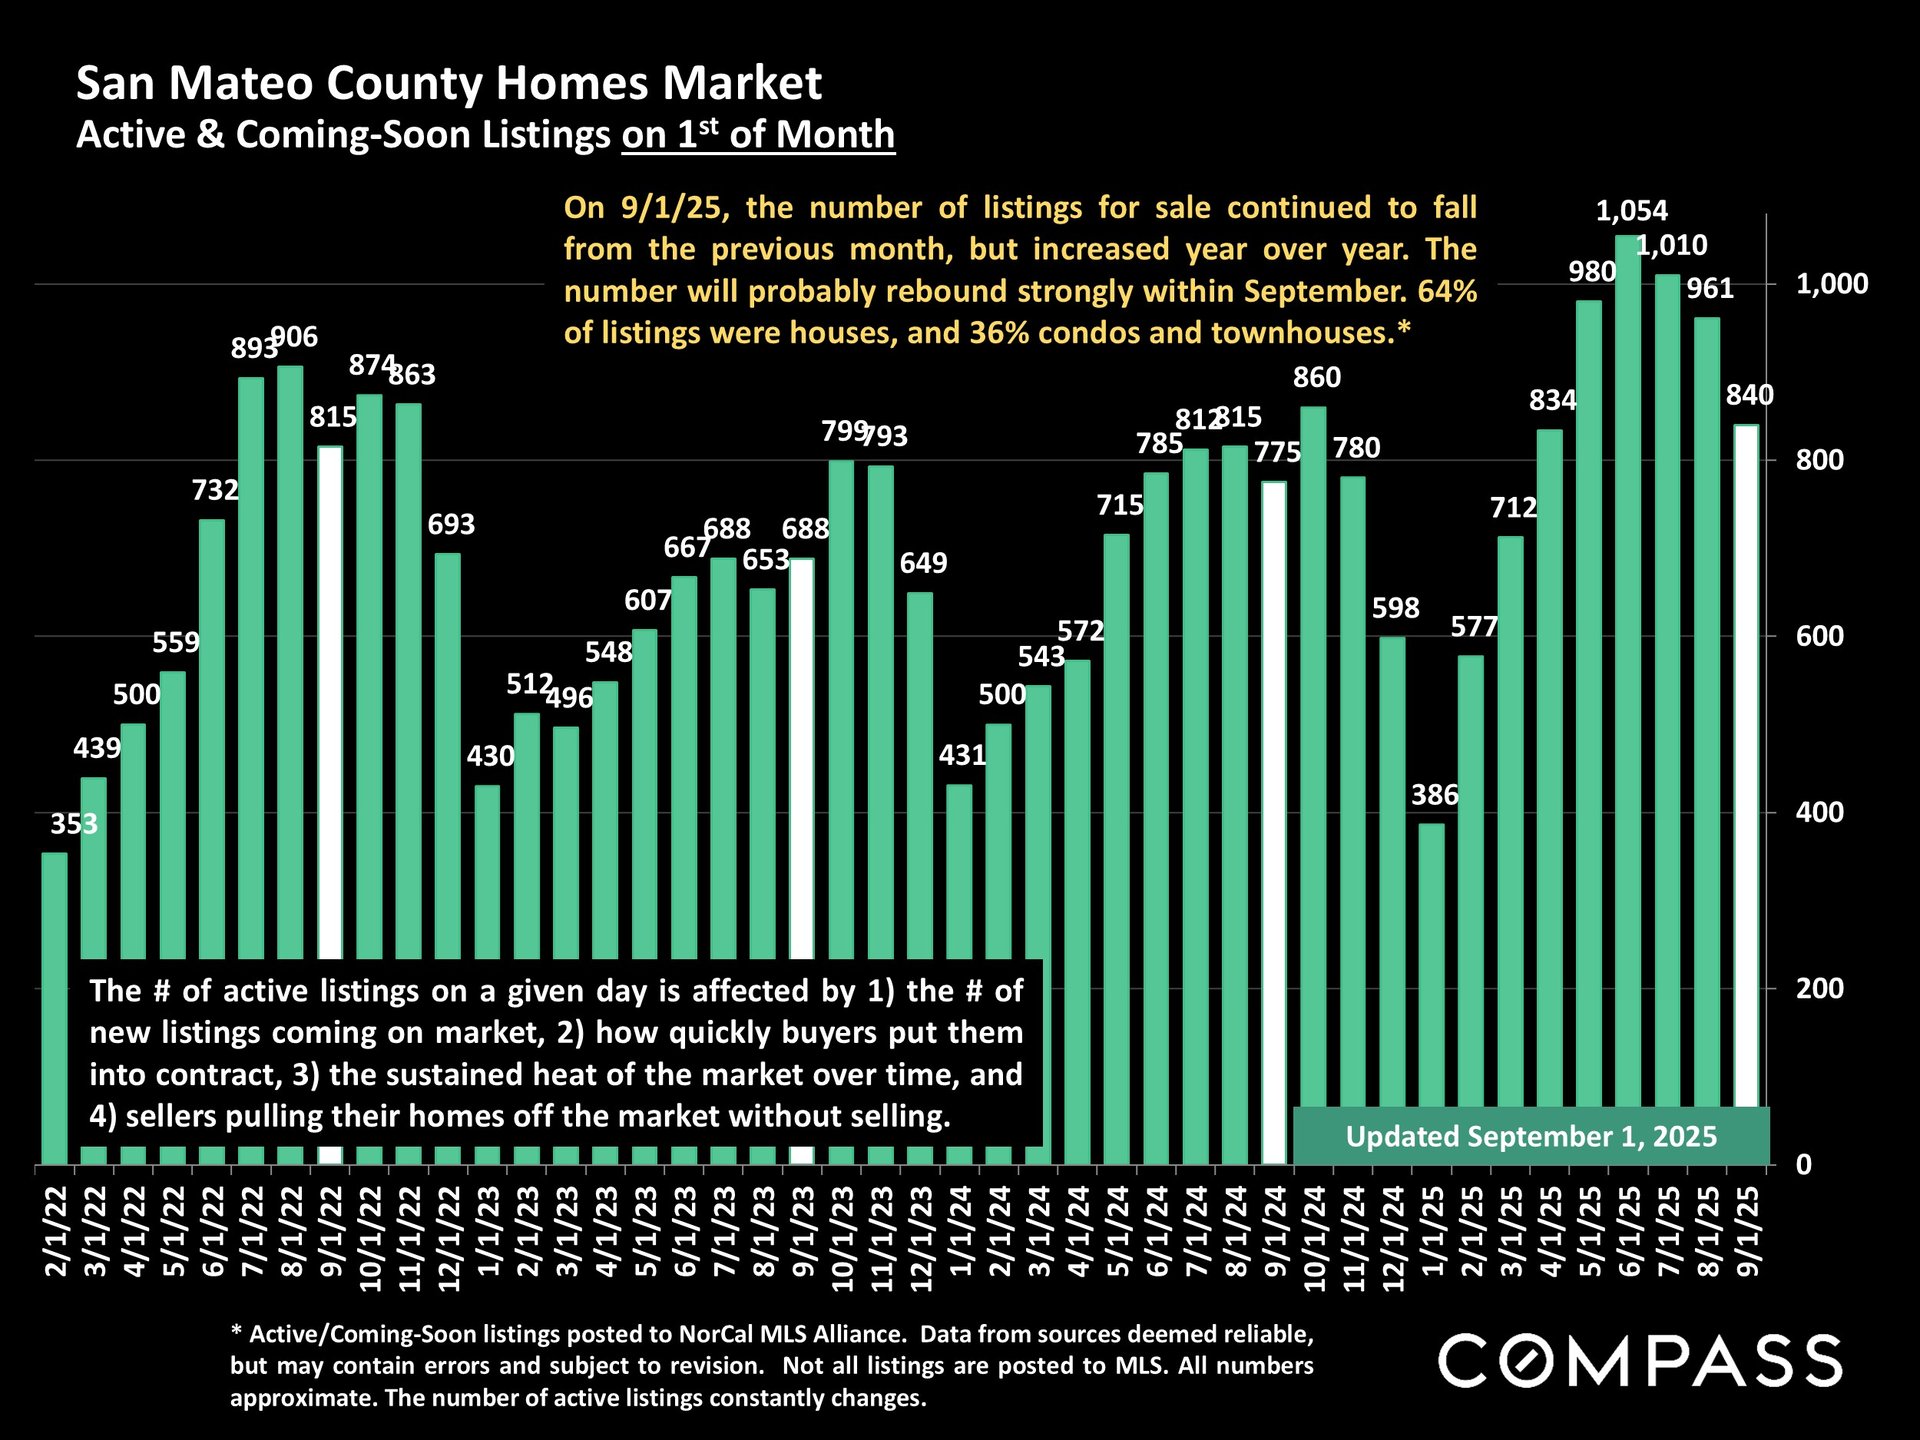
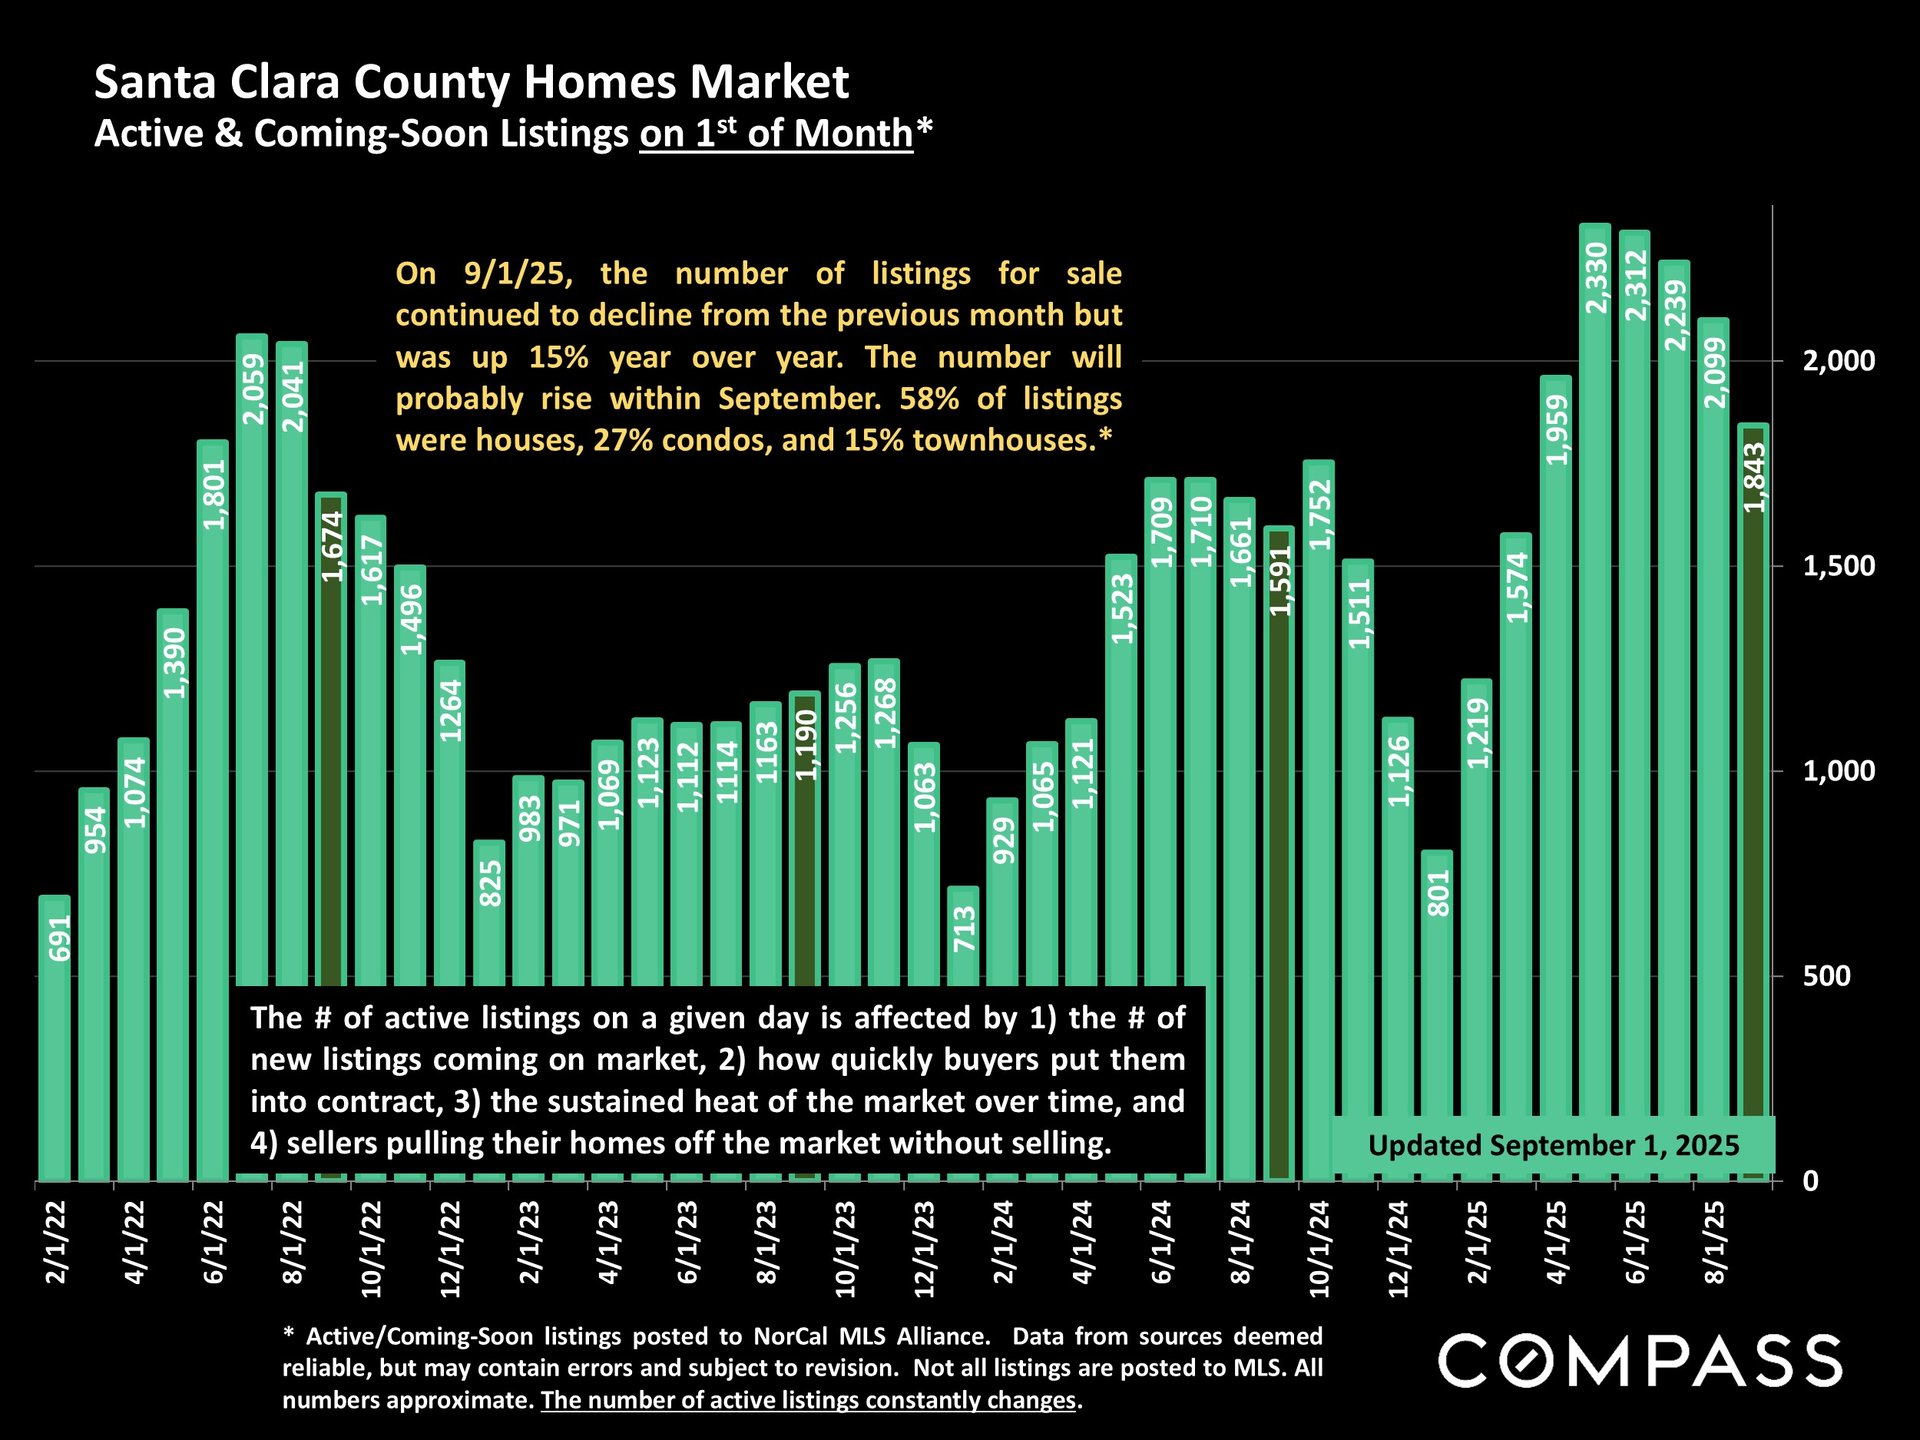
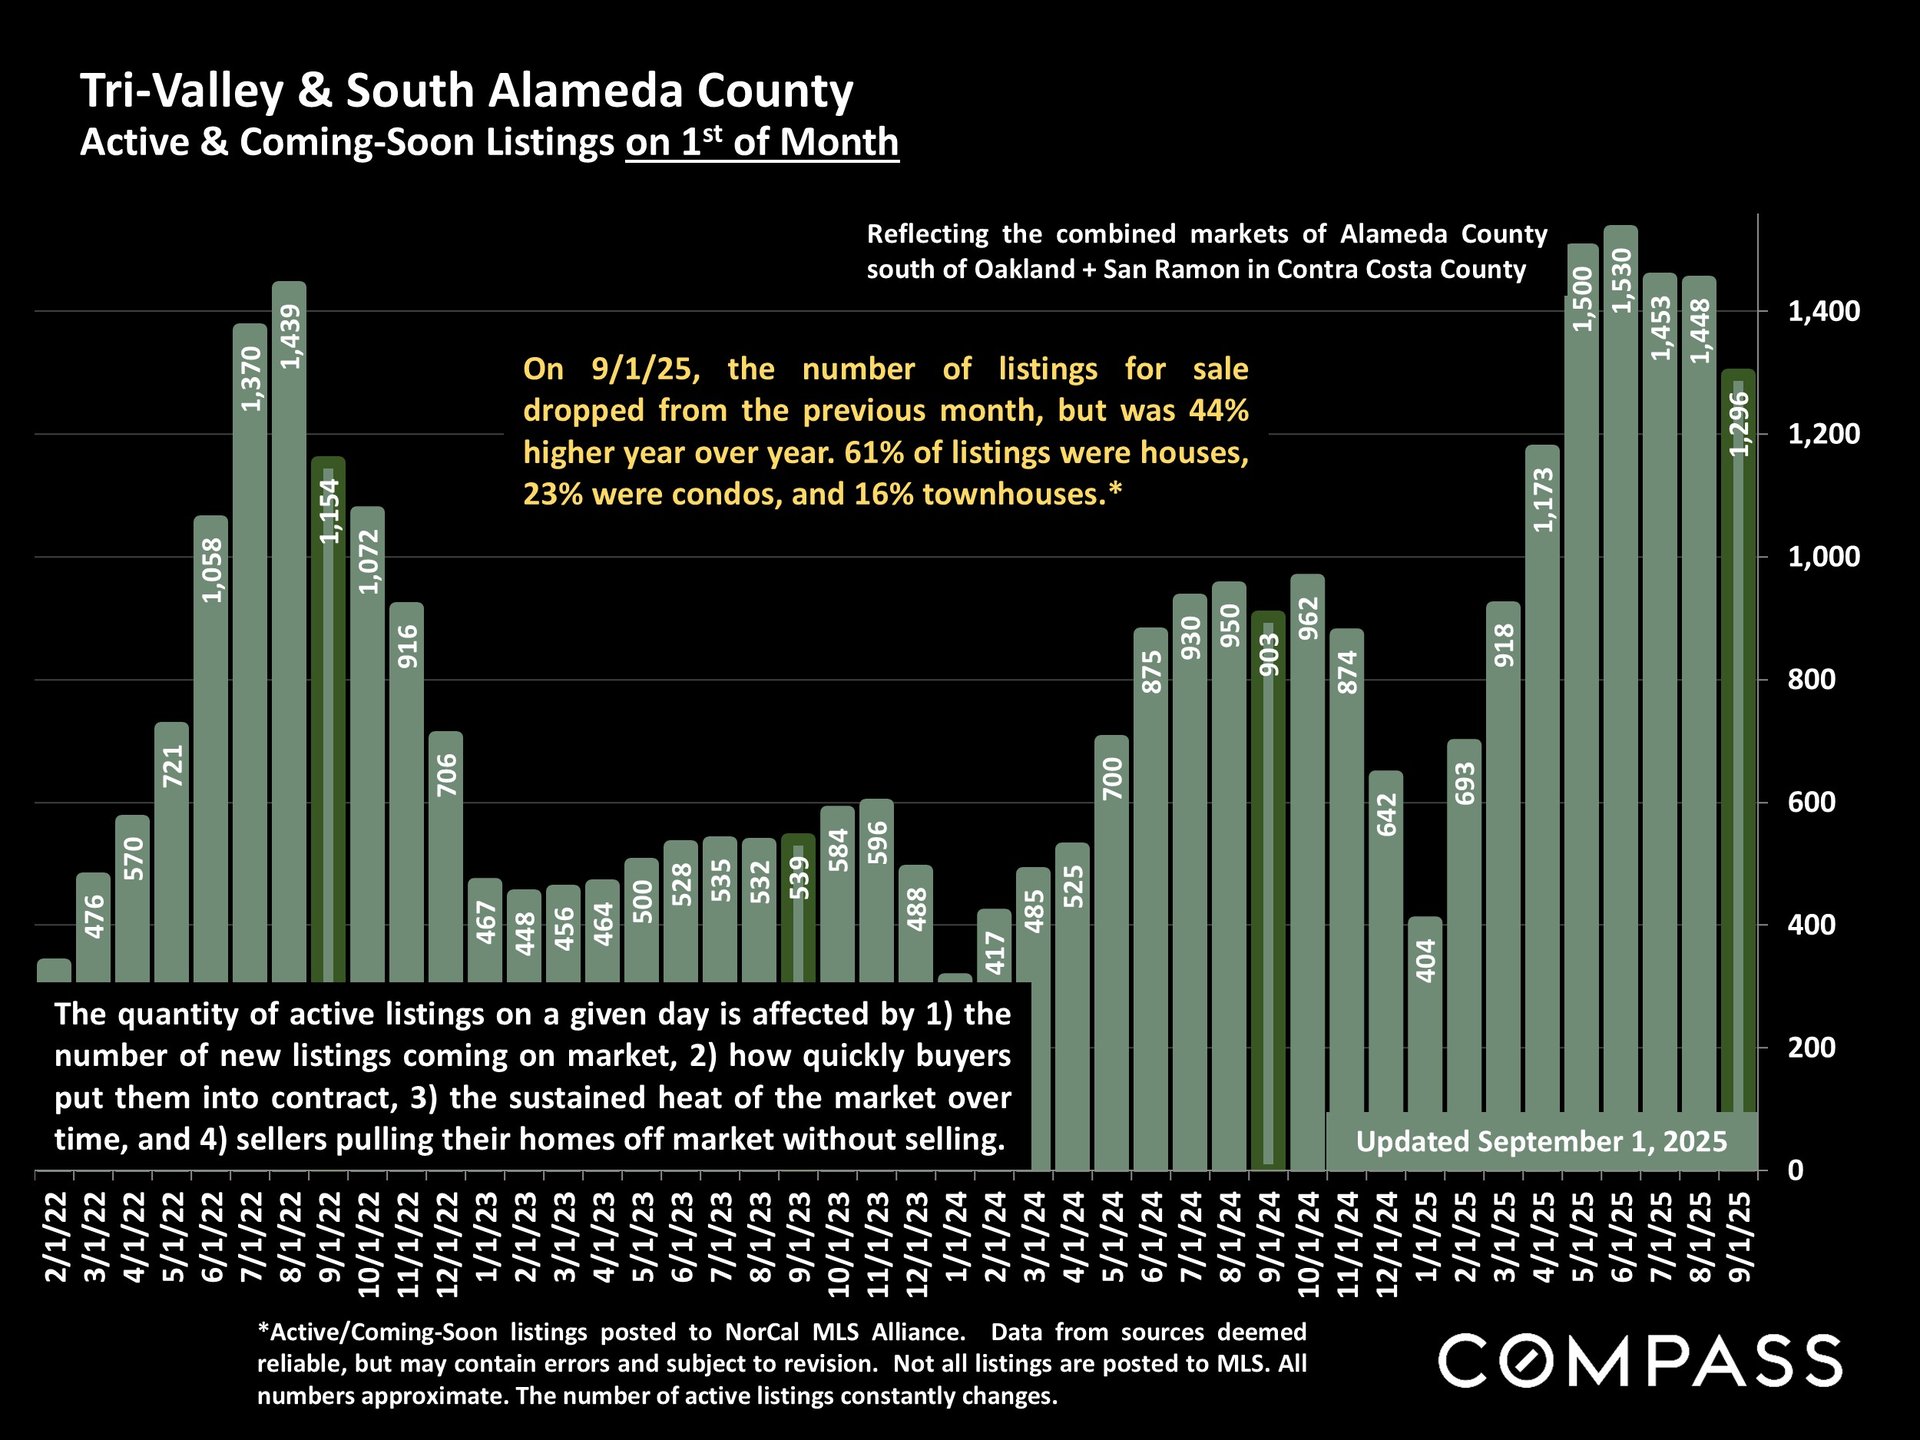
Active Listings (August 2025 vs. August 2024)
-
San Mateo: +14%.
-
Santa Clara: +18%.
-
Alameda: +19%.
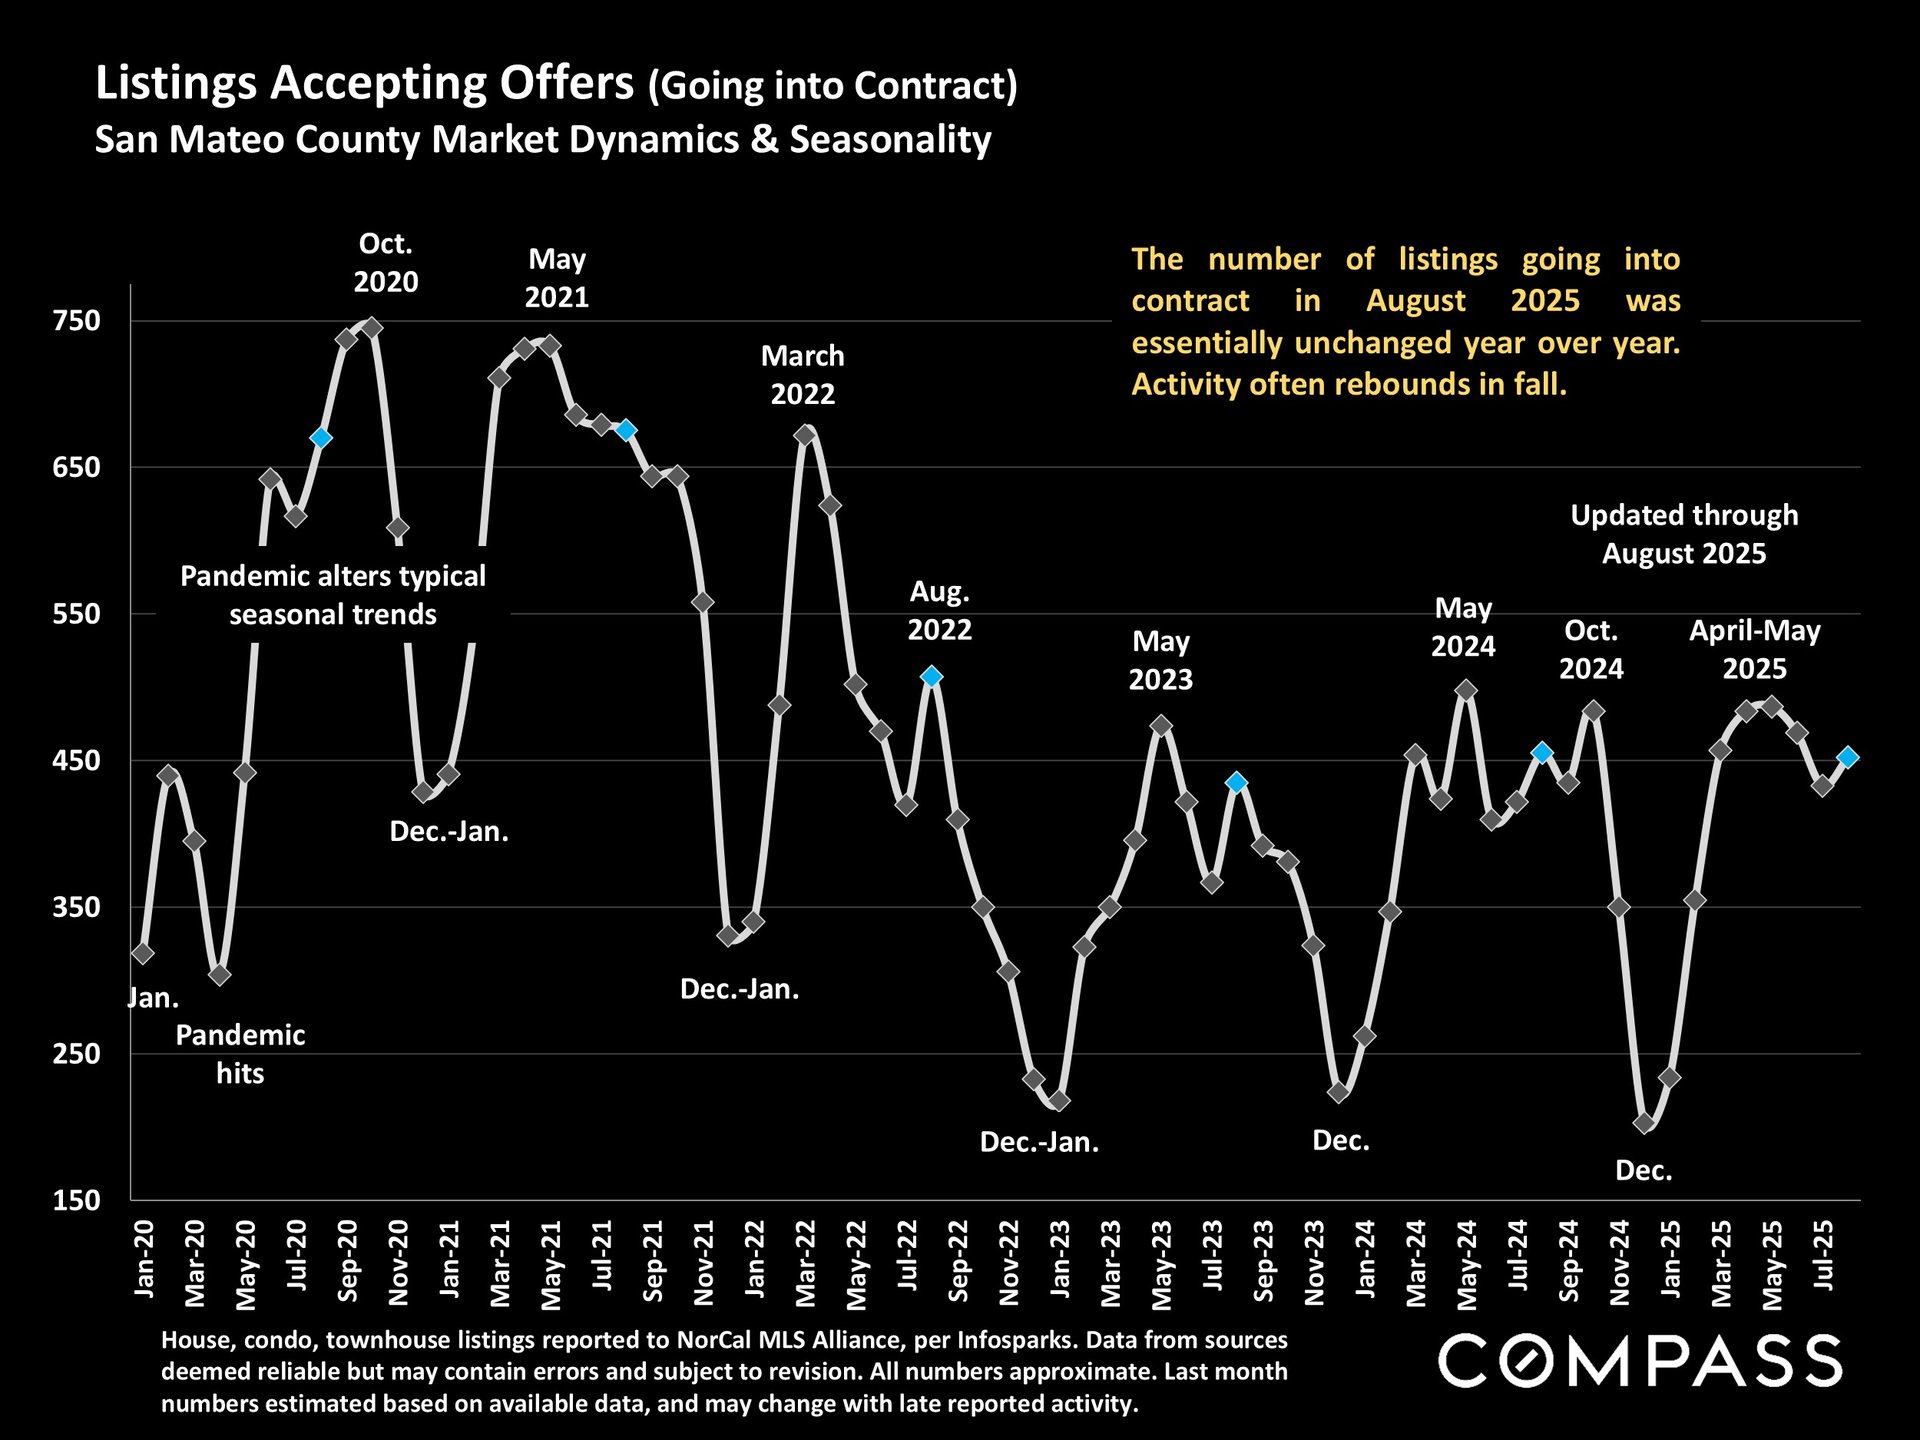
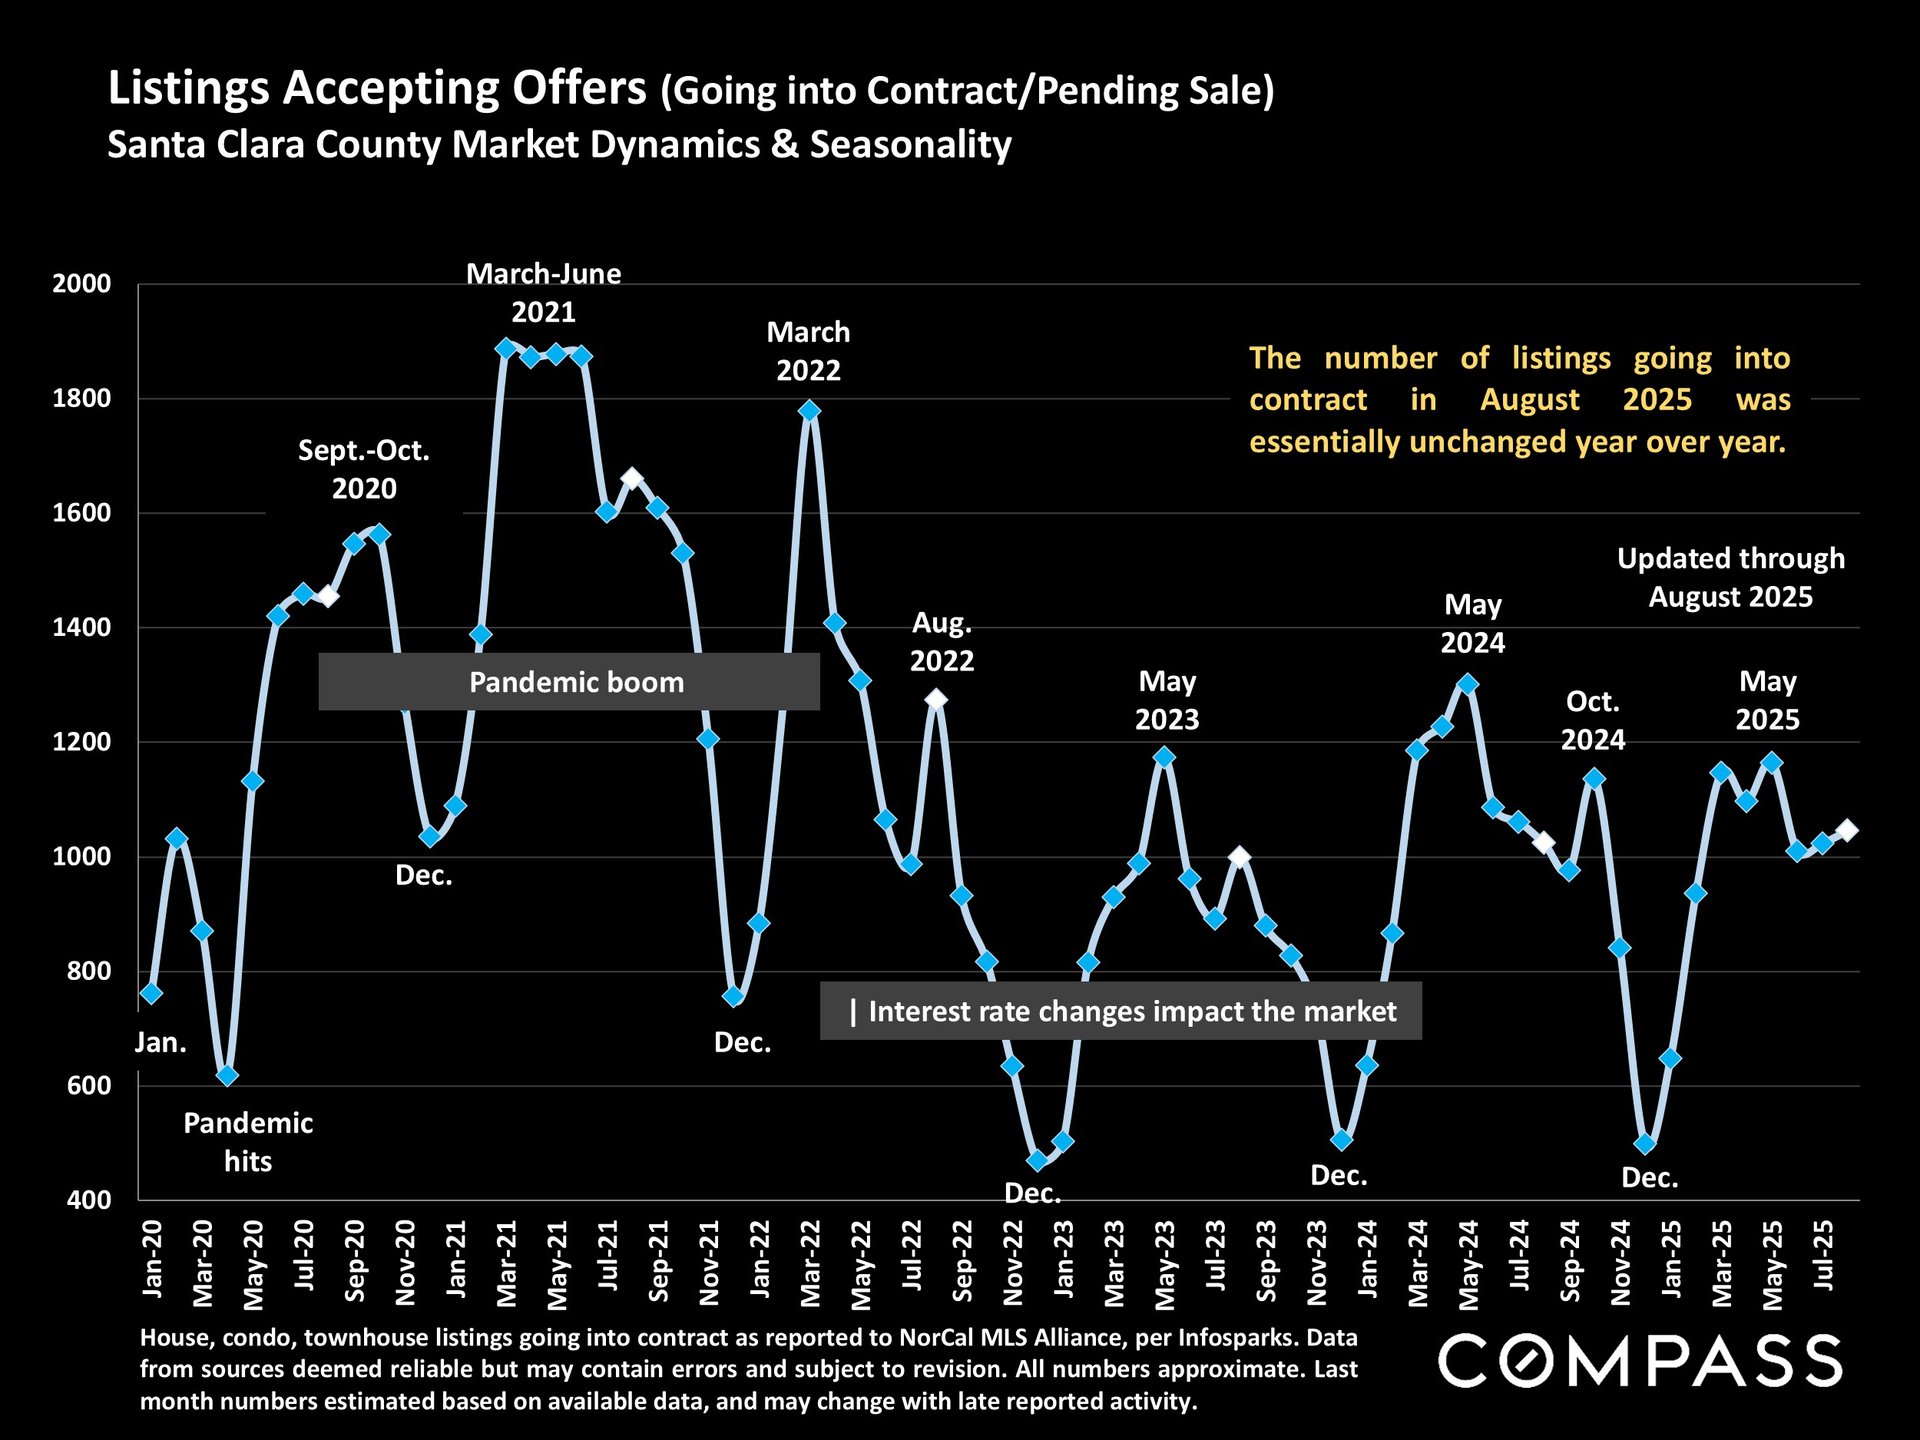
Listings Accepting Offers (August 2025 vs. August 2024)
-
San Mateo: –8%.
-
Santa Clara: –10%.
-
Alameda: –12%.
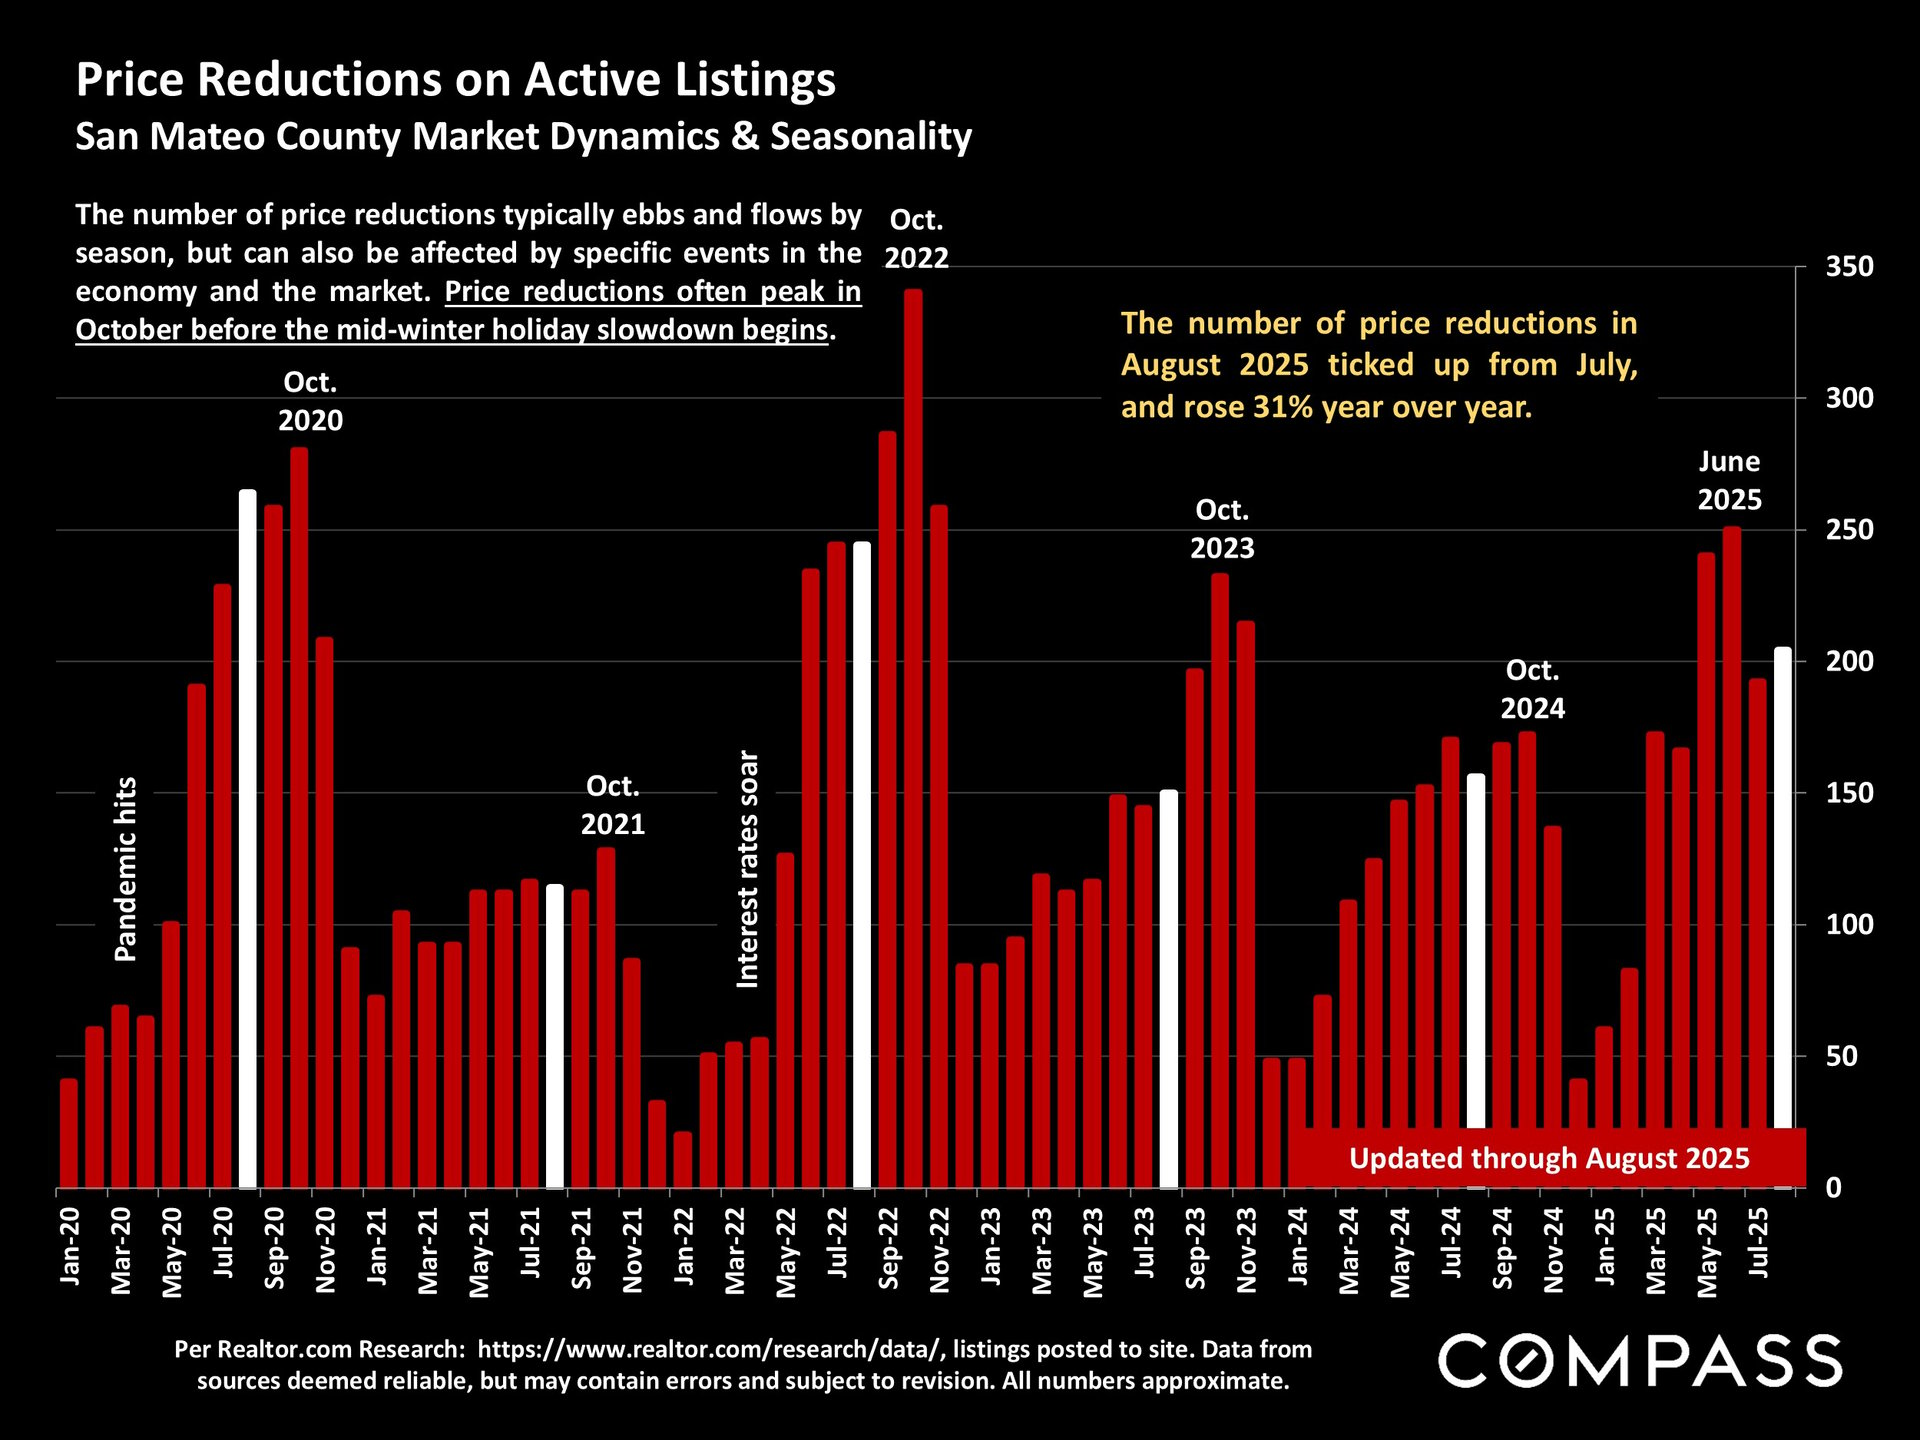
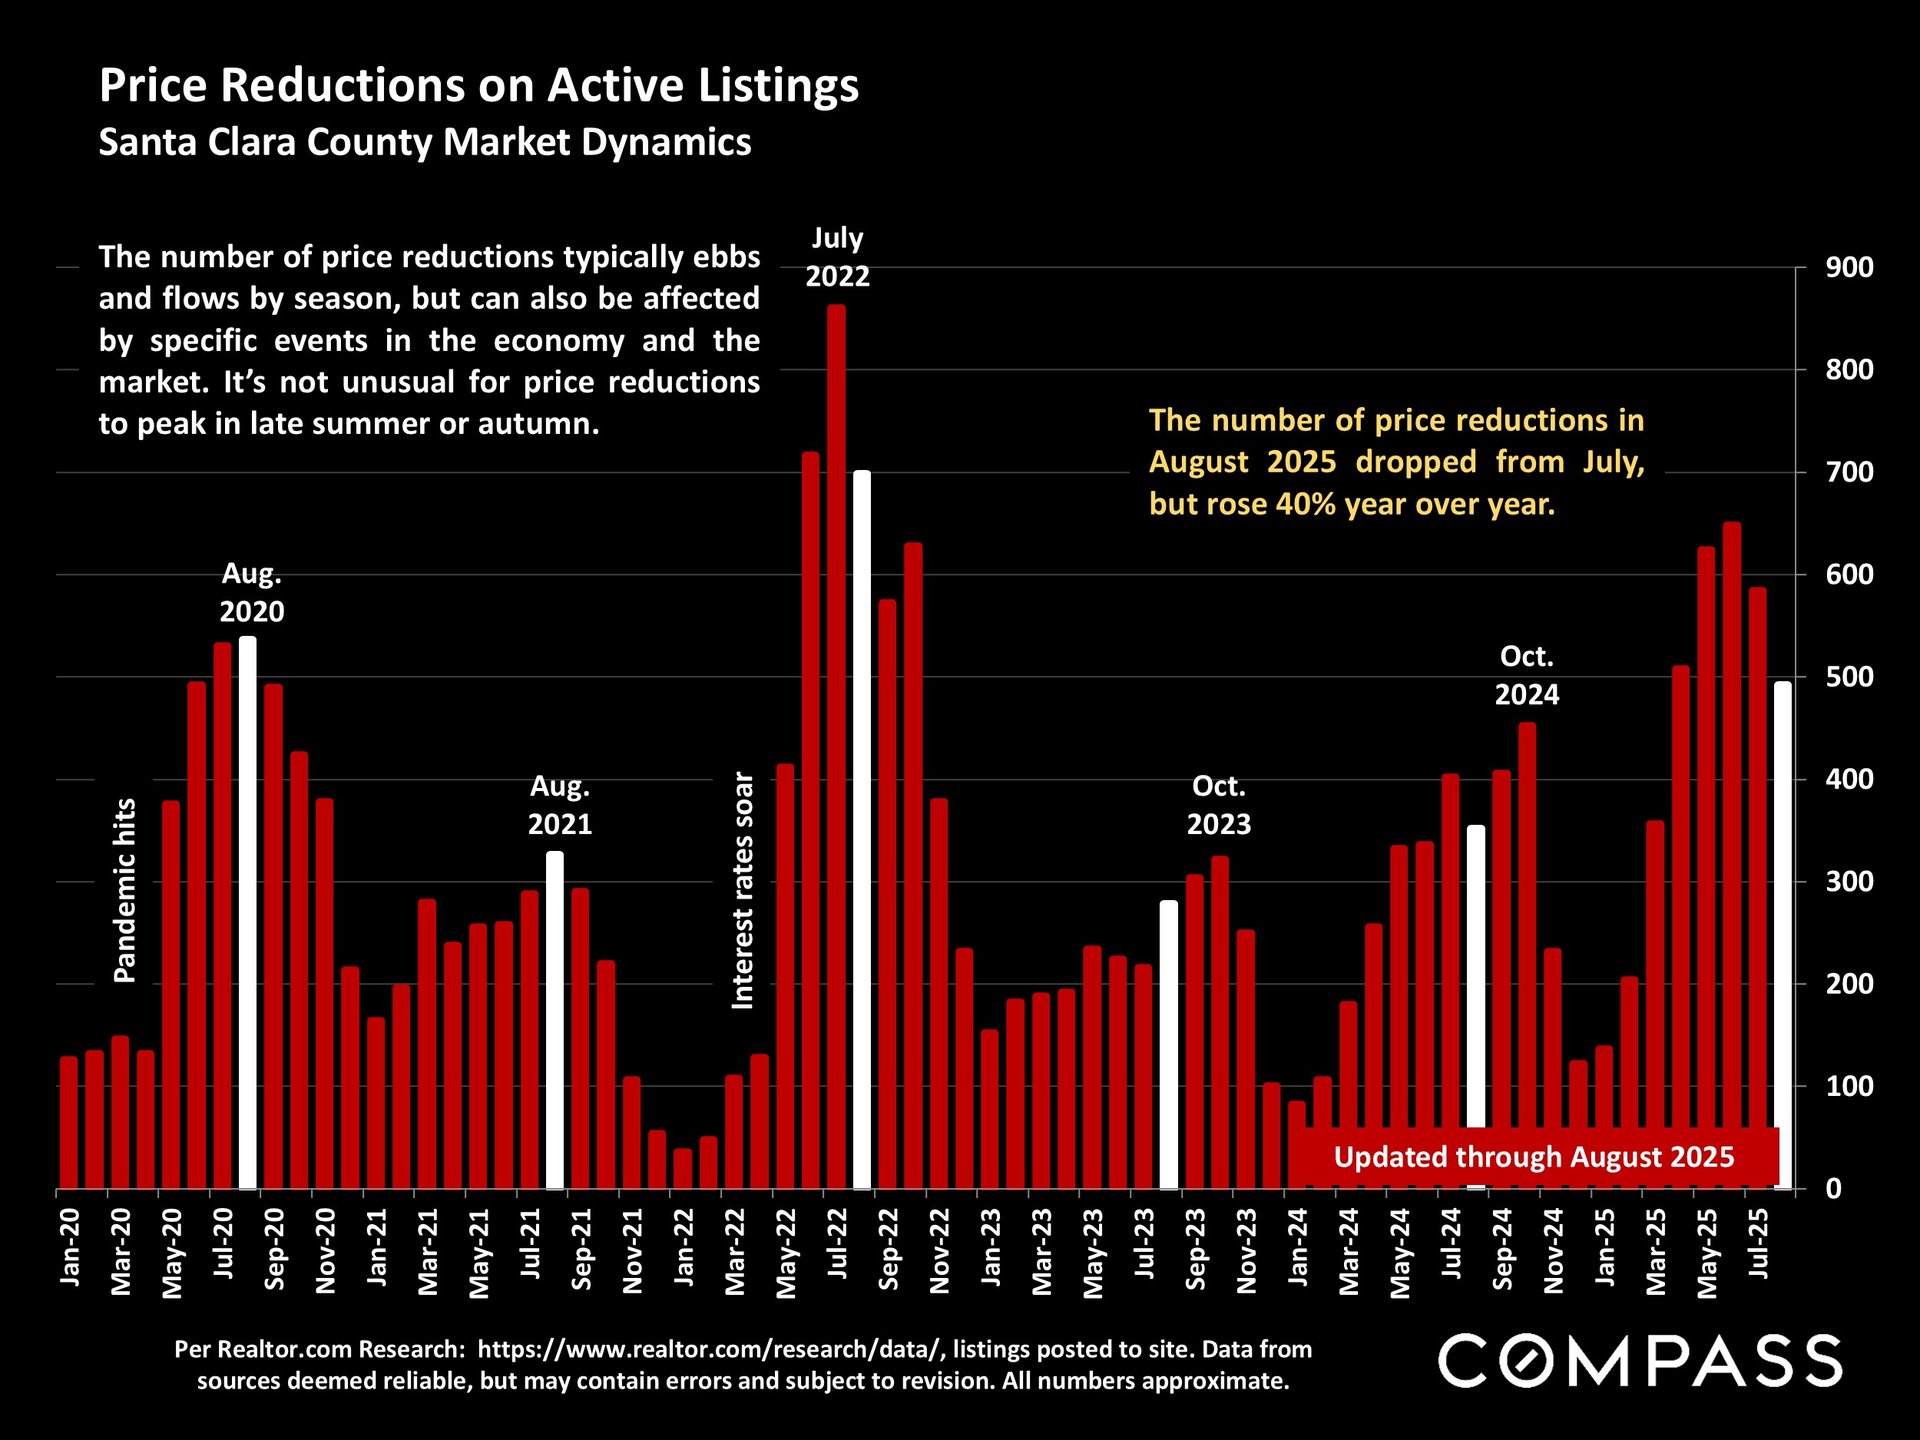
Price Reductions (August 2025 vs. August 2024)
-
San Mateo: +31%.
-
Santa Clara: +40%.
-
Alameda: +45%.
Sales Price to Listing Price Ratio (August 2025 vs. August 2024)
-
San Mateo: 102% → 100.5%.
-
Santa Clara: 103% → 100%.
-
Alameda: 102% → 99%.
Days on the Market (August 2025 vs. August 2024)
-
San Mateo: 21 → 28 days (+7).
-
Santa Clara: 21 → 29 days (+8).
-
Alameda: 20 → 27 days (+7).
Median Price (August 2025 vs. August 2024)
-
San Mateo: Single-family homes flat; condos down ~6%.
-
Santa Clara: Houses $1,950,000 median (+1.5%); condos –3%.
-
Alameda: Townhomes –10%; condos –11%.
Months of Inventory (August 2025 vs. August 2024)
-
San Mateo: 2.0 → 2.4 months.
-
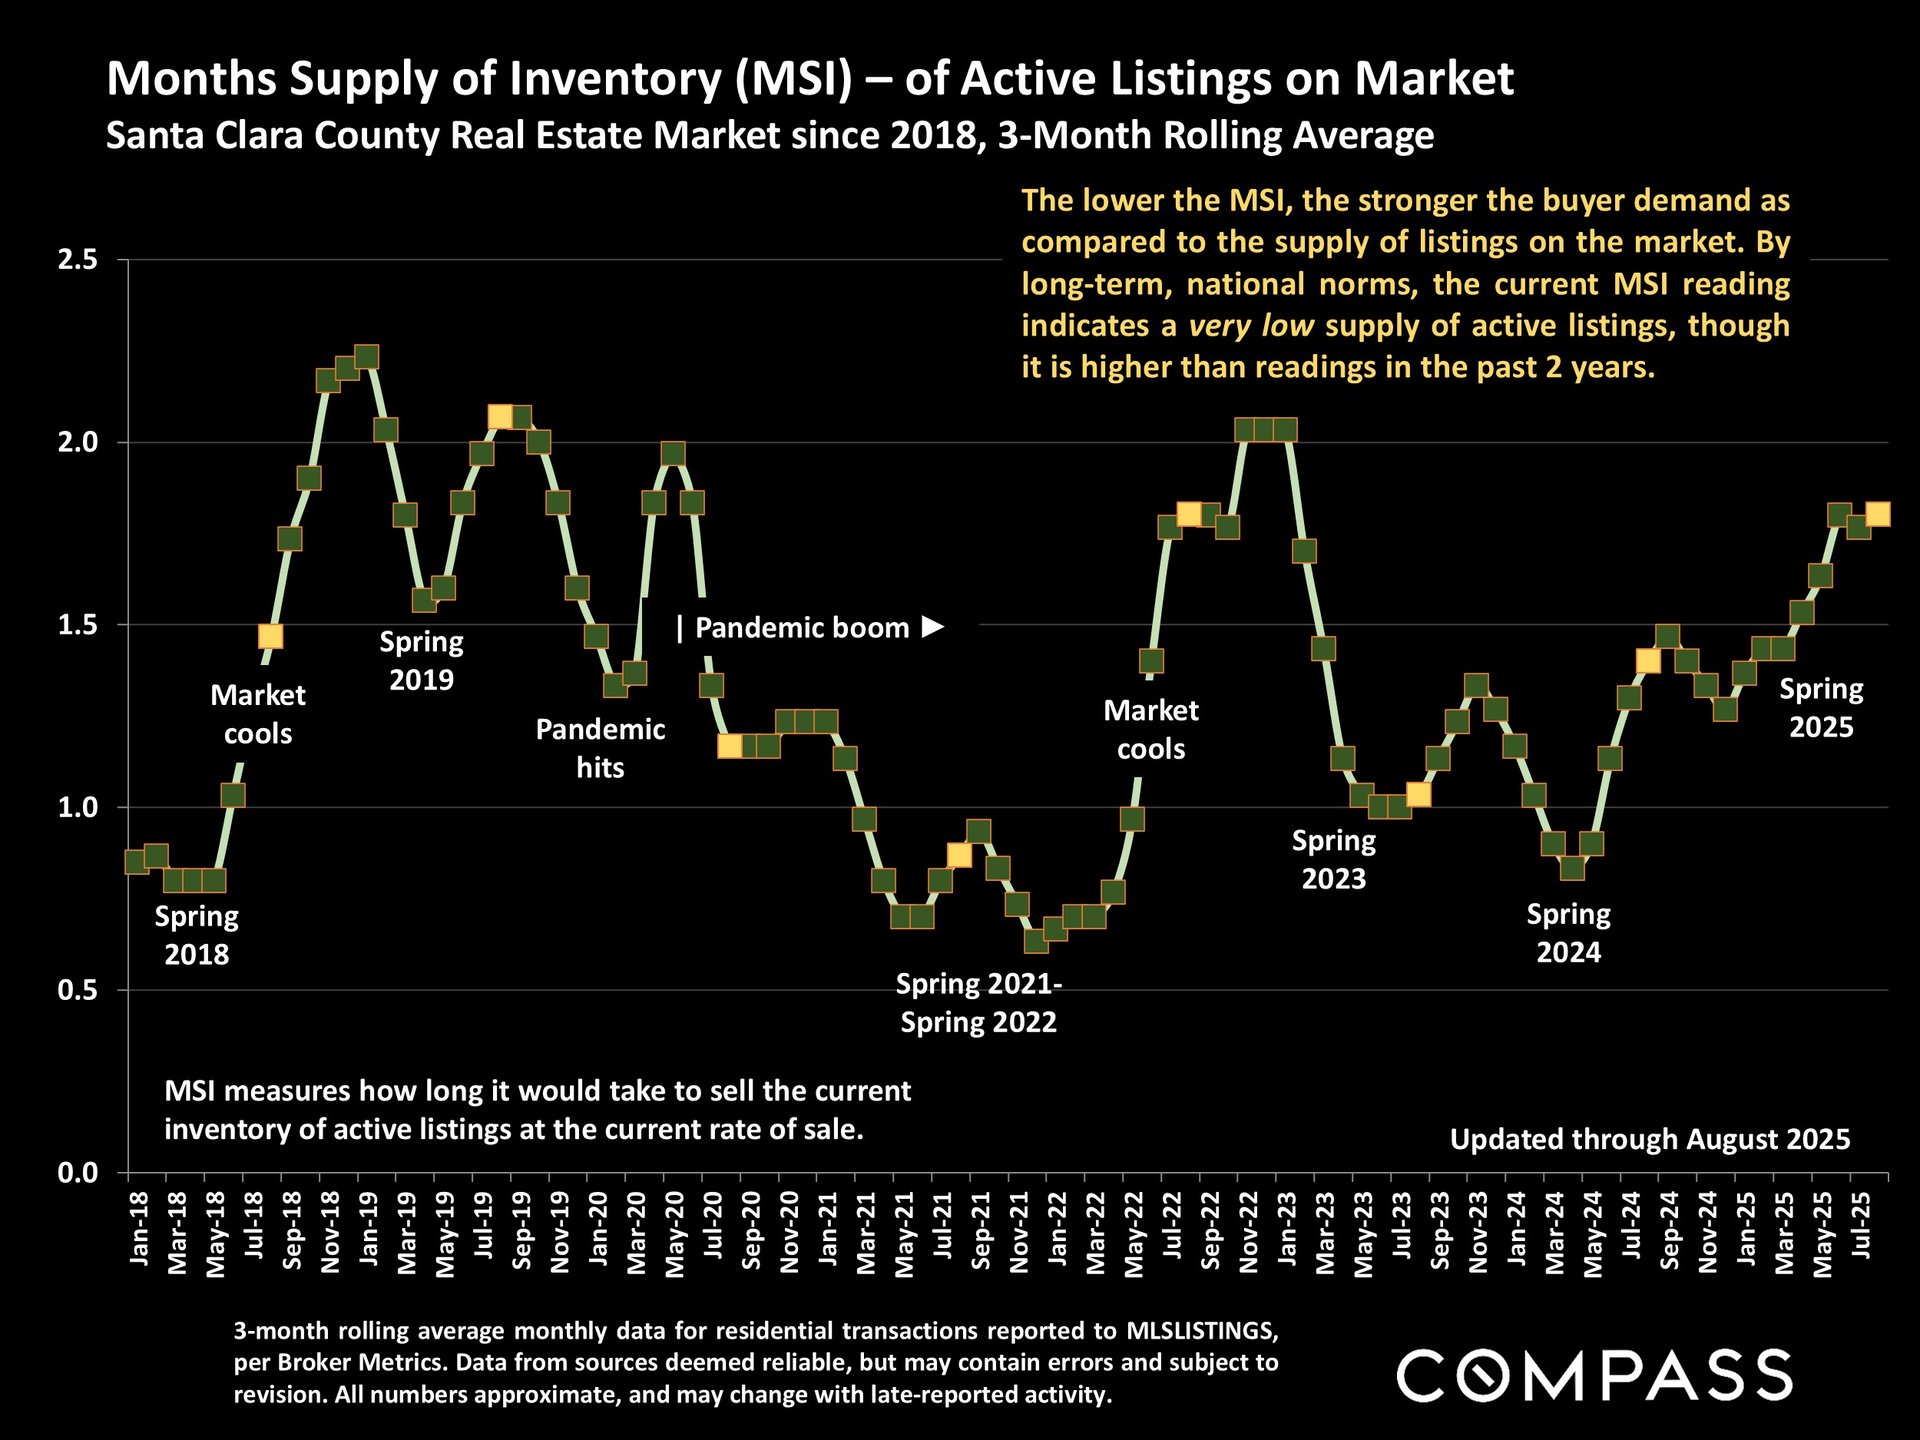
Santa Clara: 1.8 → 2.2 months.
-
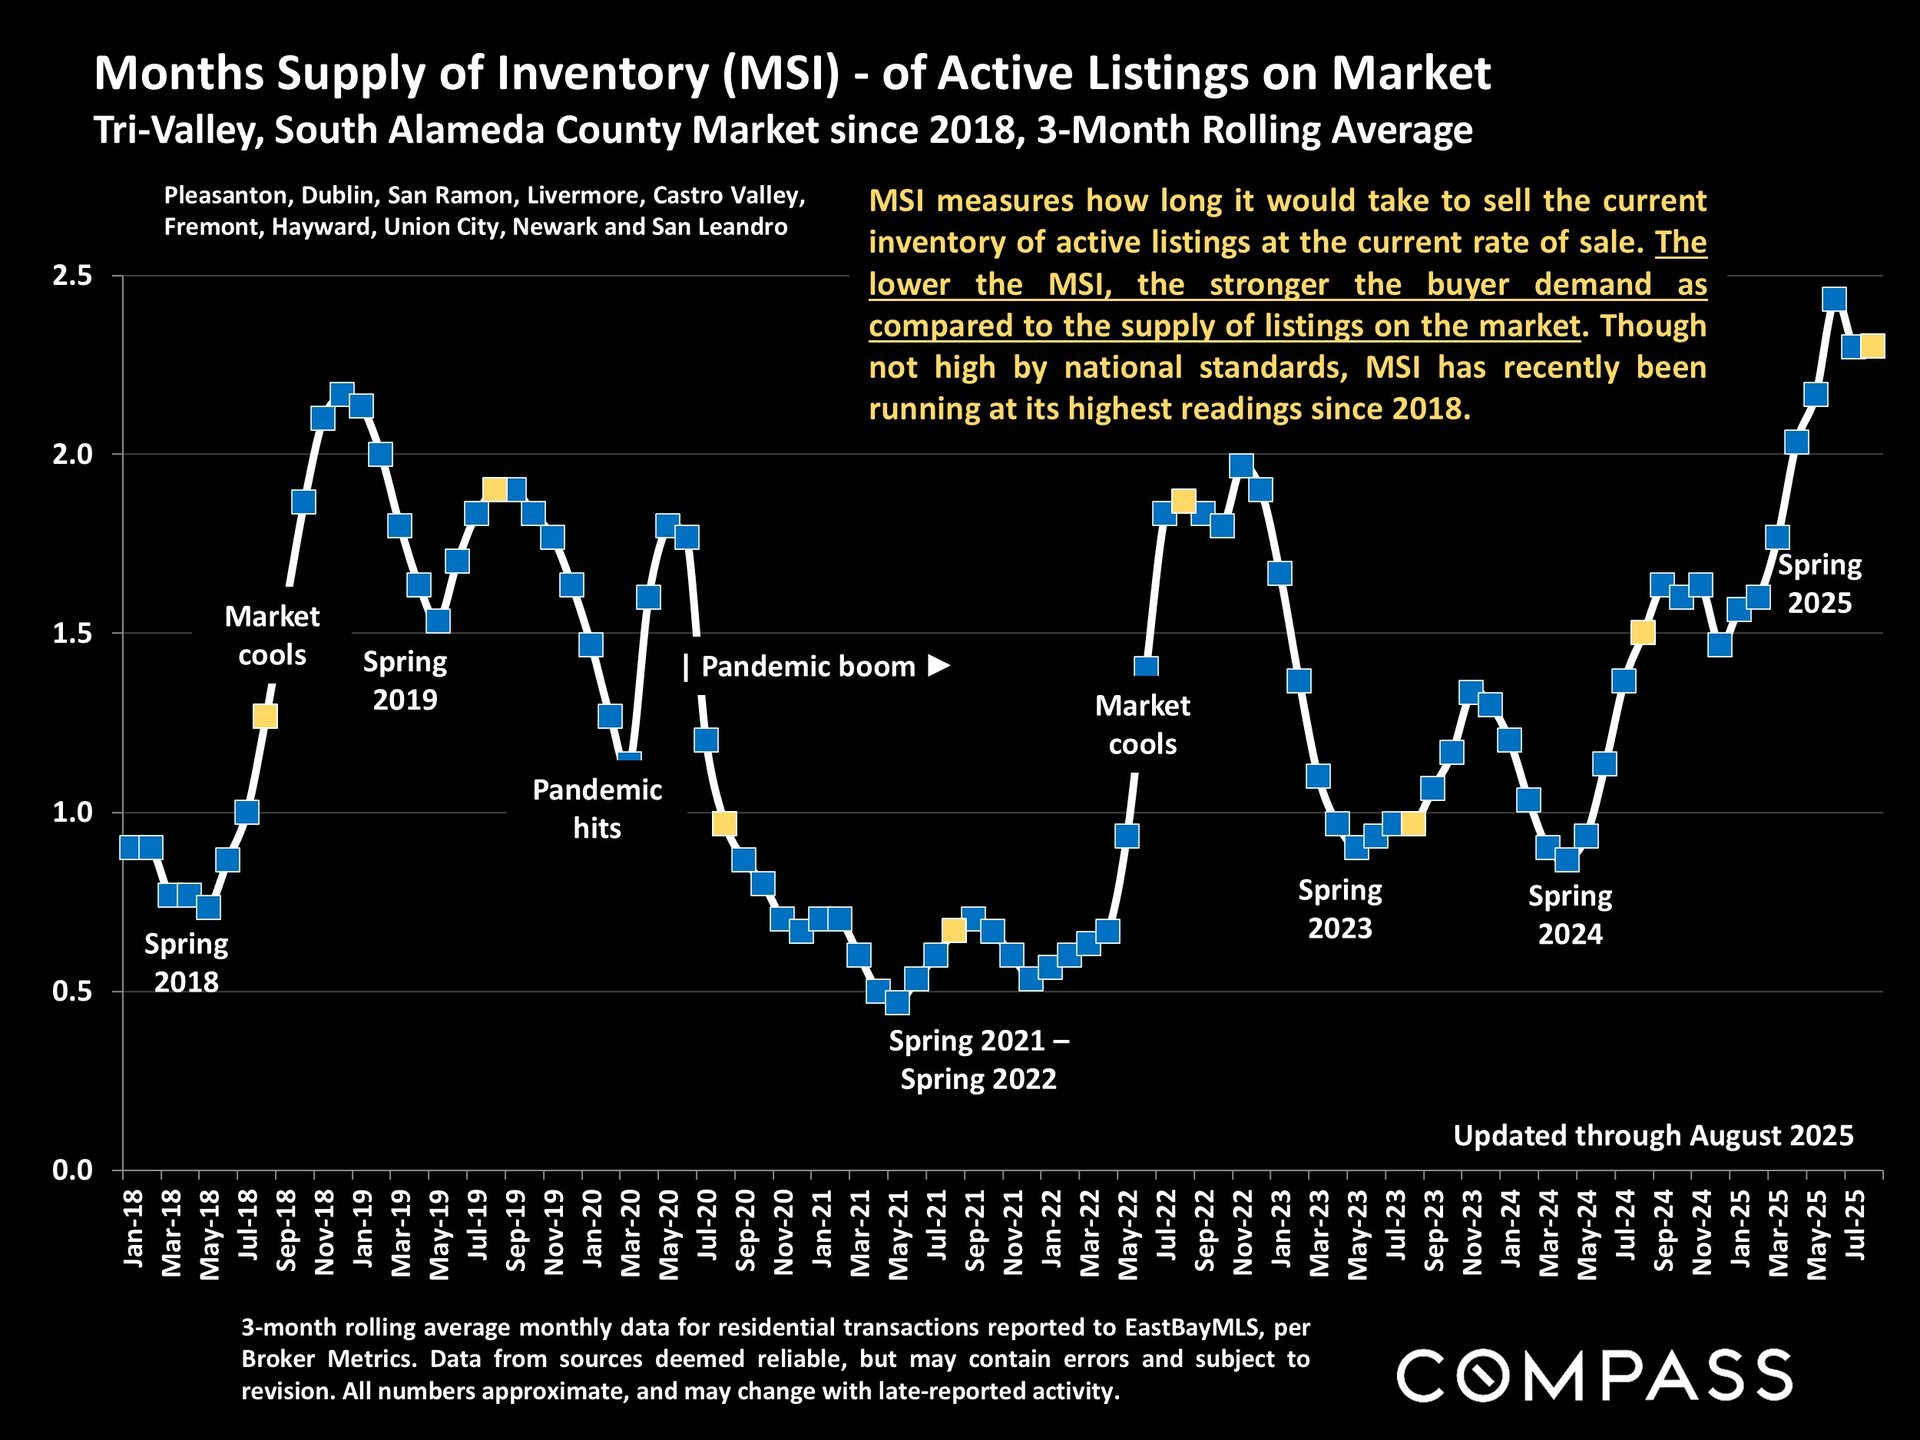
Alameda: 2.1 → 2.5 months.
Pending Sales (August 2025 vs. August 2024)
-
San Mateo: –7%.
-
Santa Clara: –9%.
-
Alameda: –11%.
Luxury Home Sales (August 2025 vs. August 2024)
-
San Mateo: $5M+ sales surged in spring but dropped sharply in August.
-
Santa Clara: $5M+ sales up 34% year-to-date compared to 2024.
-
Alameda: $2M+ sales down 12% year-to-date.
City Highlights (Median Prices – Last 12 Months)
-
San Mateo: Atherton $8.3M, Hillsborough $5.3M, Portola Valley $4.35M.
-
Santa Clara: Palo Alto $3.2M, Cupertino $2.4M, Sunnyvale $2.0M.
-
Alameda: Pleasanton $1.6M, Dublin $1.4M, Fremont $1.5M.
Here are two takeaways:
- Market activity remains muted but stable, with pending sales holding steady compared to last year.
- Inventory and pricing pressures are increasing, as more listings come to market and sellers adjust expectations.
Did you know that if you only check Zillow, you may miss over 700 off-market listings in the Bay Area? This is before Anywhere merged with Compass!
Call us today to unlock your customized off-market opportunities and receive a free consultation (650-630-9810).