Bay Area Real Estate Market Update – October & November 2025

Bay Area Real Estate Market Update – October & November 2025

With our engineering background, we analyze data carefully to help you achieve the best outcomes. Below is a snapshot of the October 2025 real estate market in San Mateo, Santa Clara, and Alameda Counties.

Market Snapshot

Short-Term Appreciation (Nov 2025 vs. Nov 2024)

• San Mateo: Single-family –2%, condos –5%
• Santa Clara: Single-family +3%, condos –4%
• Alameda: Single-family –2%, condos –16%

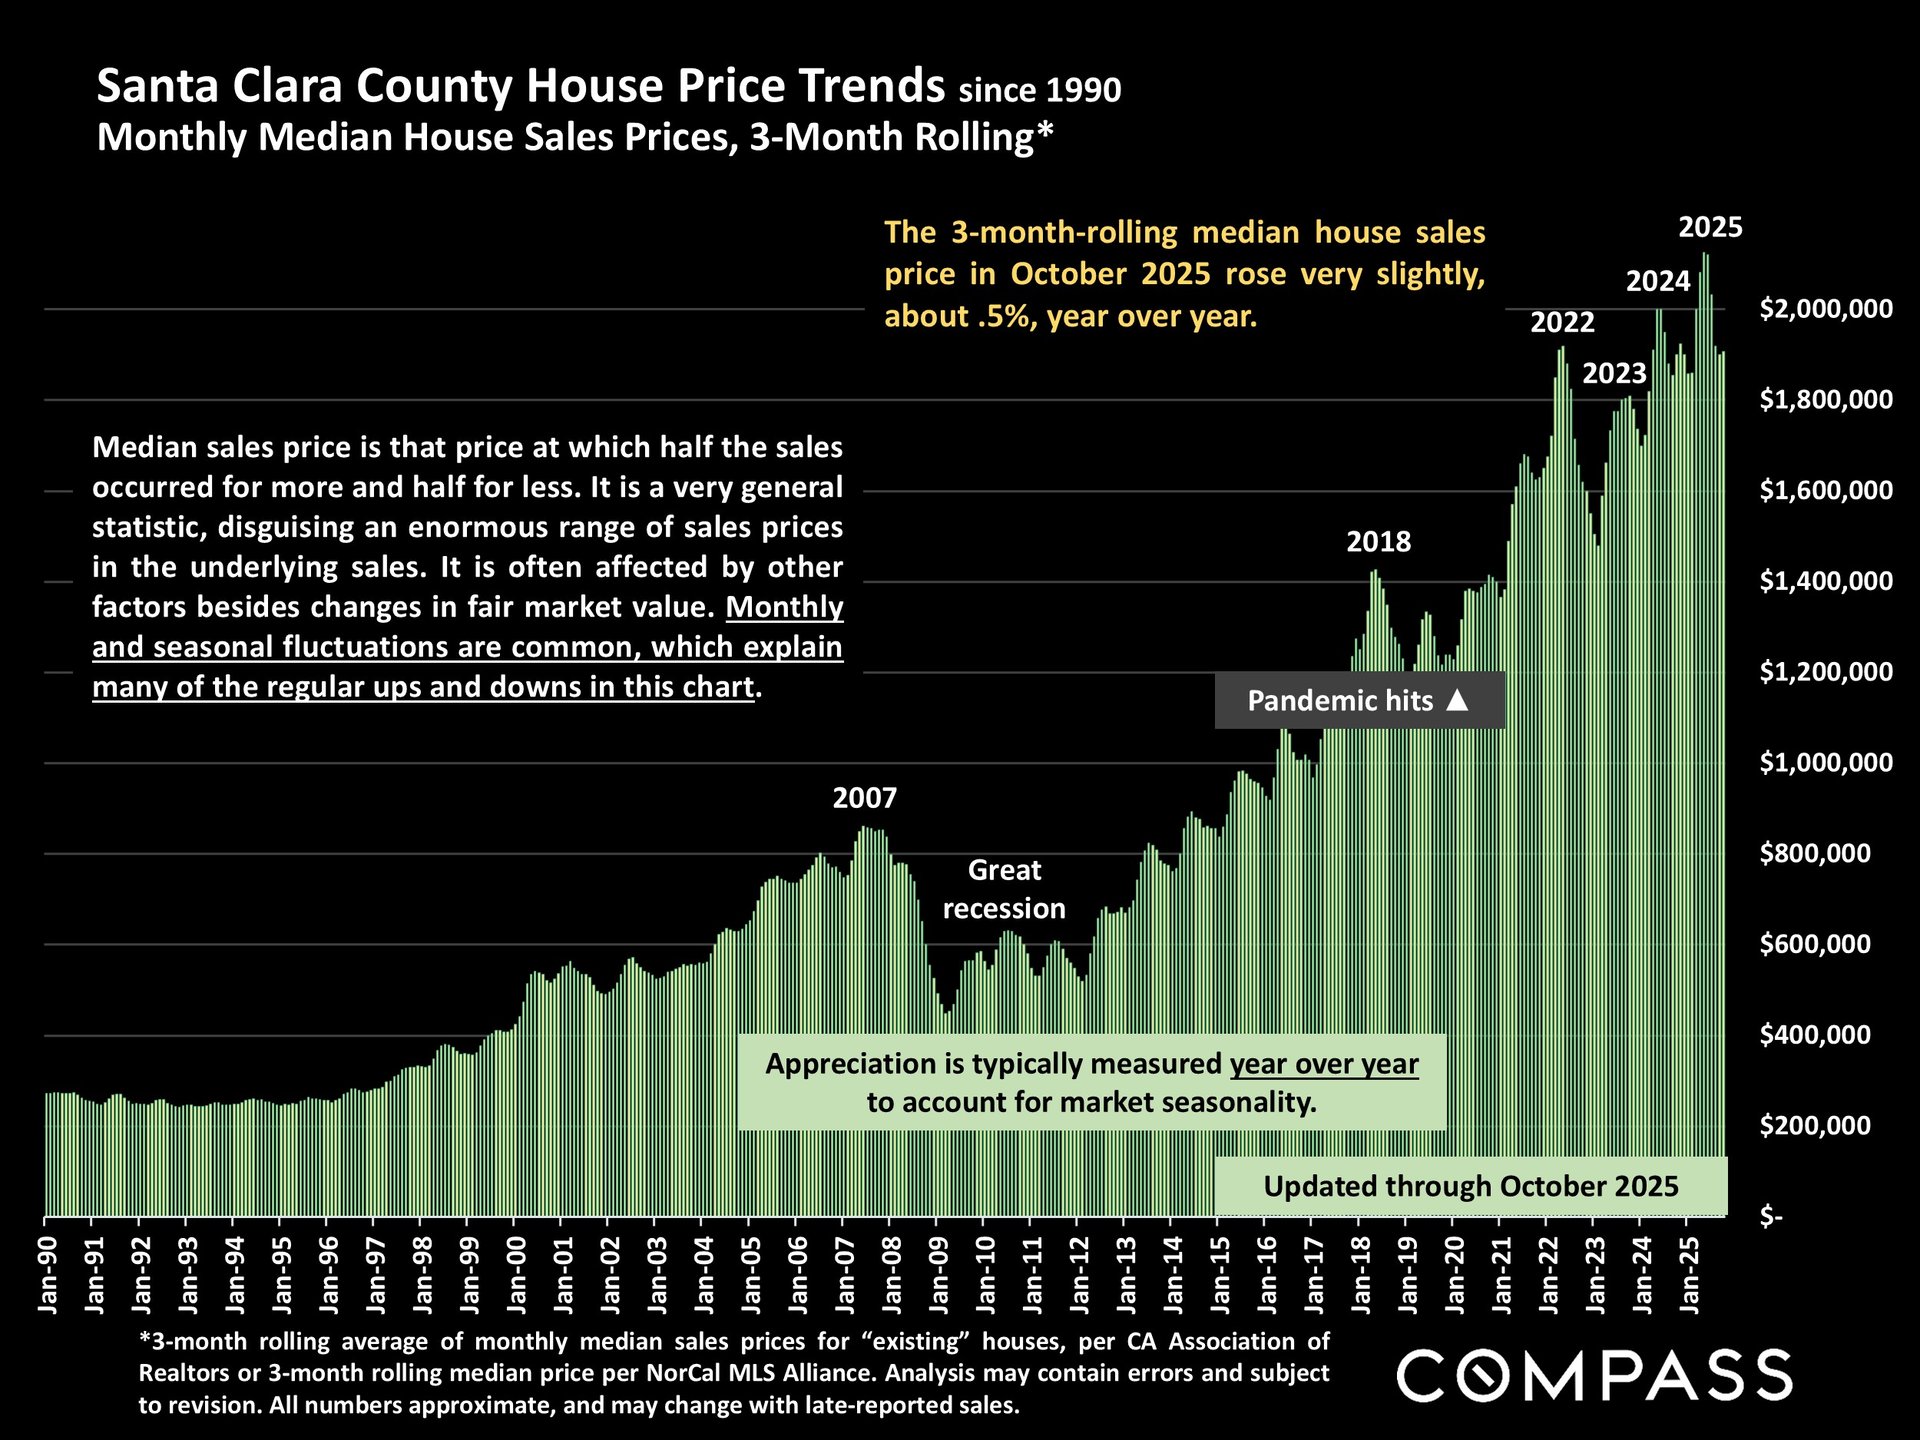
Chart of San Mateo County median house prices, 2005–2025, showing long-term growth and an October 2025 year-over-year increase.

Santa Clara County house price chart through October 2025, showing a slight year-over-year increase.

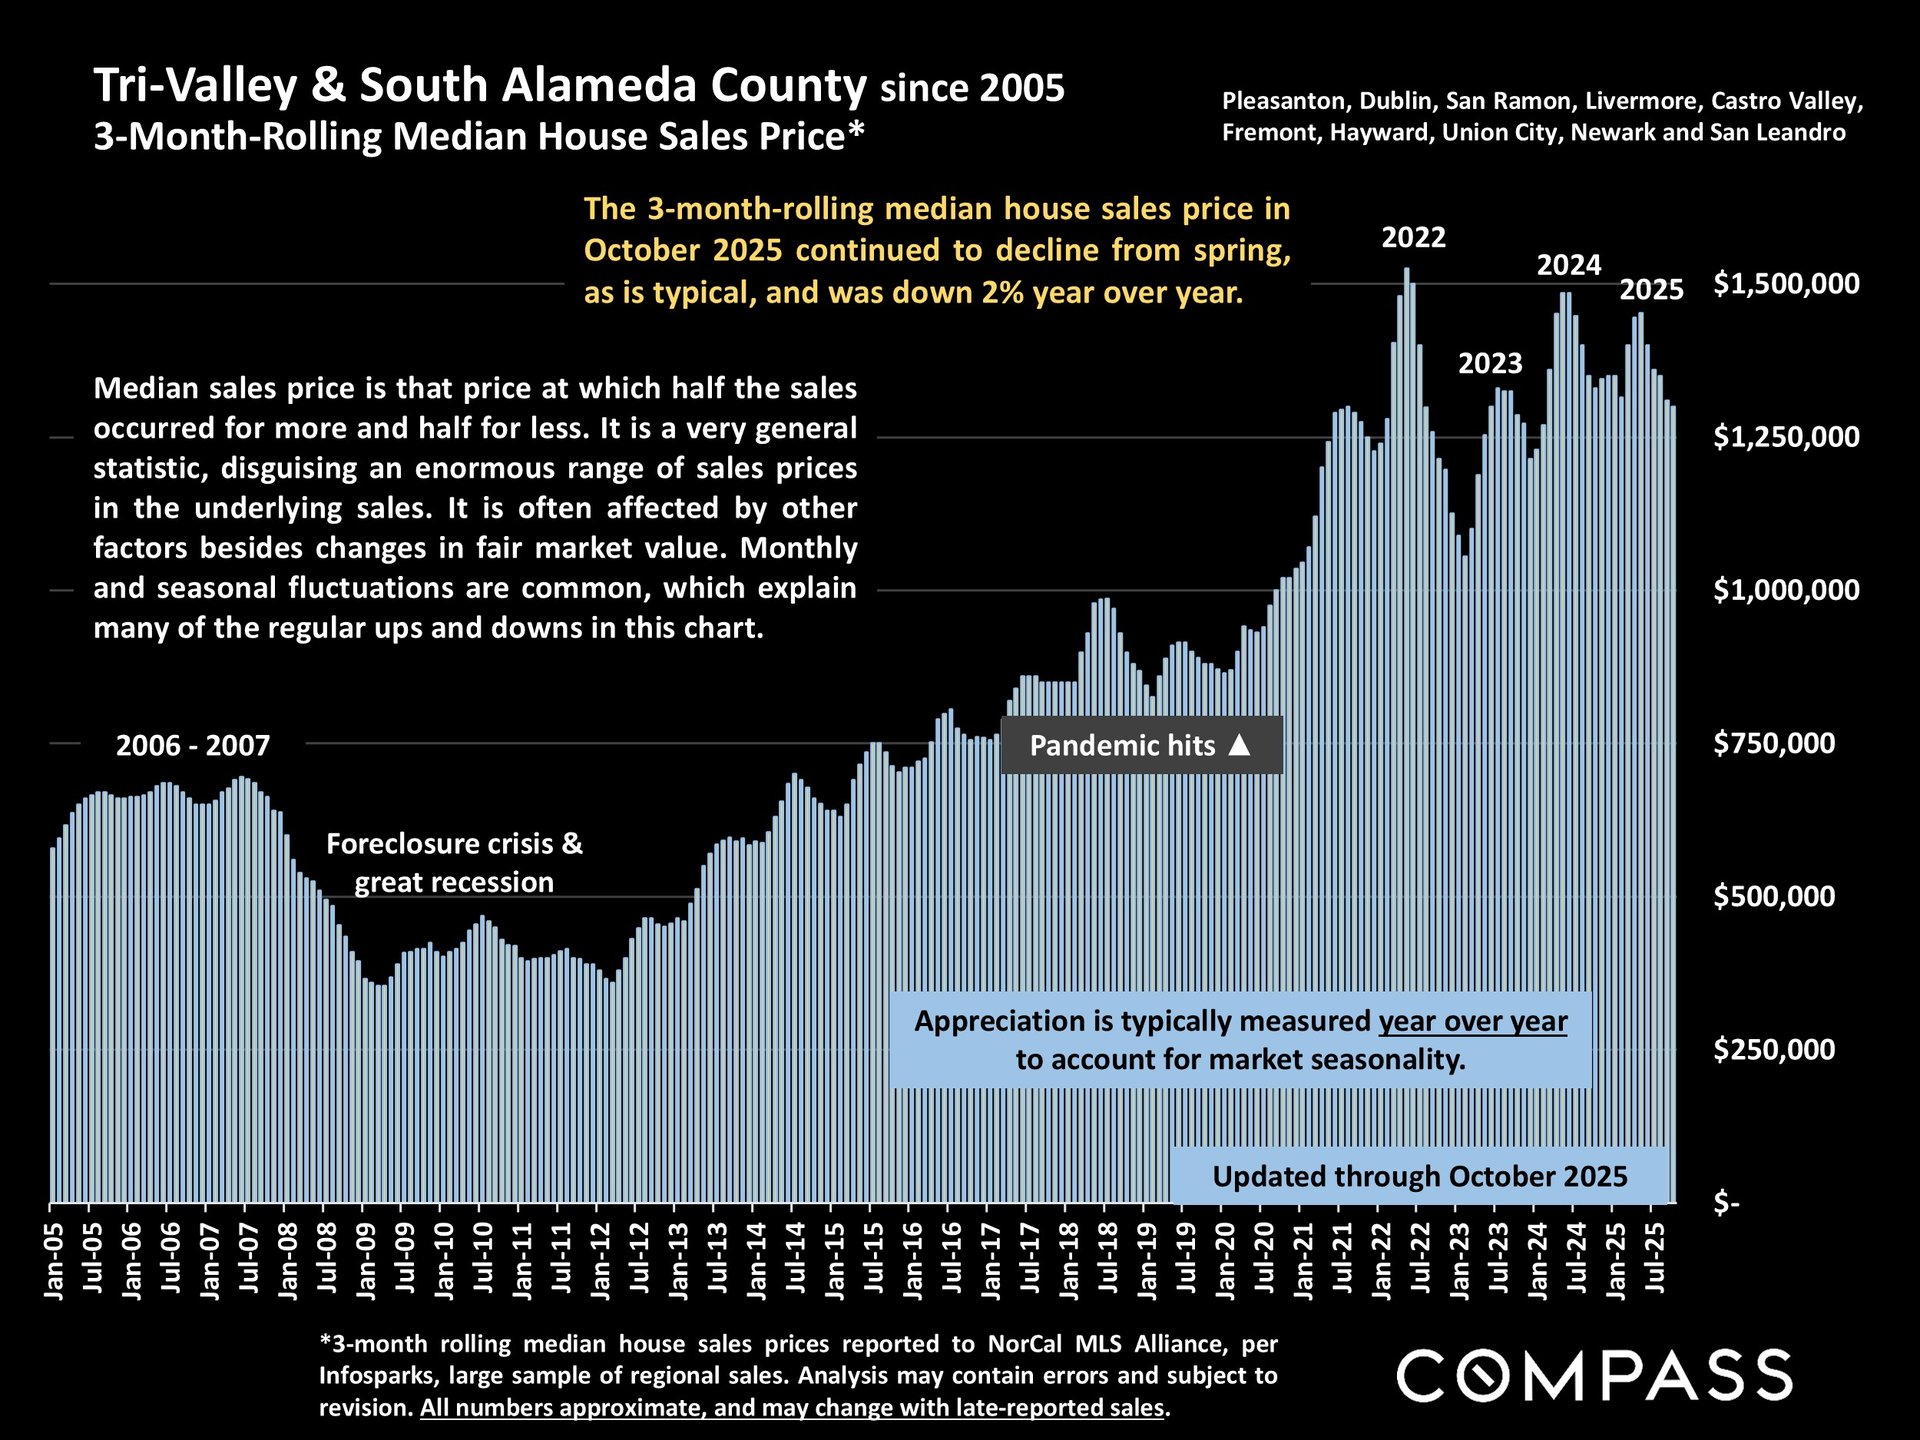
Chart of Tri-Valley and South Alameda County median home prices, 2005–2025, showing a 2% year-over-year October decline.

Long-Term Appreciation (2014 → 2025)

• San Mateo: +75% SFH, +59% condos
• Santa Clara: +90% SFH, +61% condos
• Alameda: +67% SFH, +50% condos
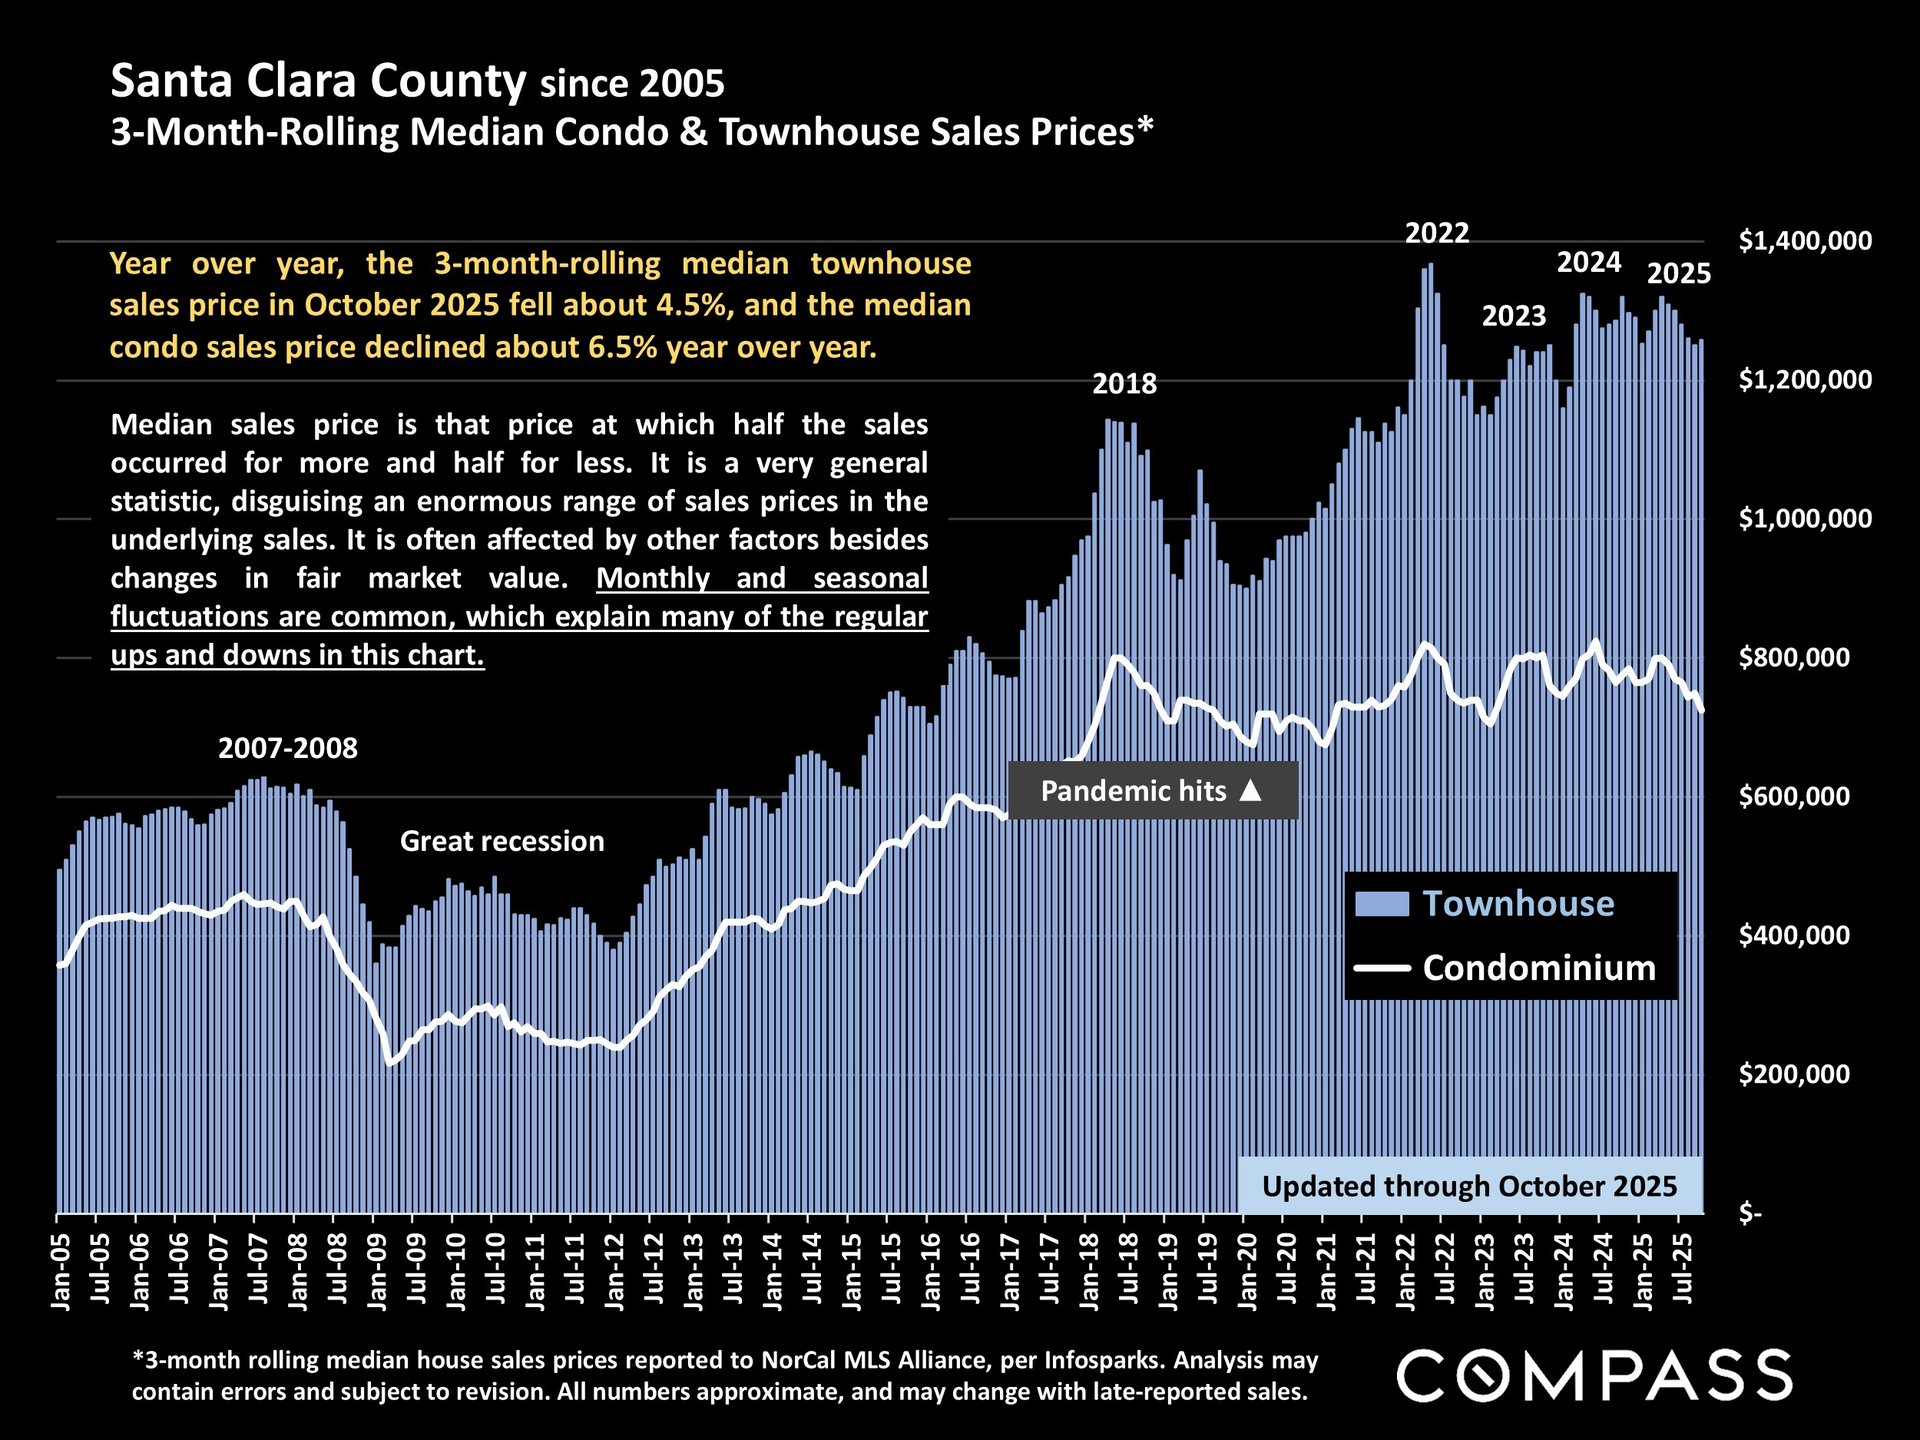
Santa Clara County condo and townhouse median sales price chart, 2005–2025, updated through October 2025.

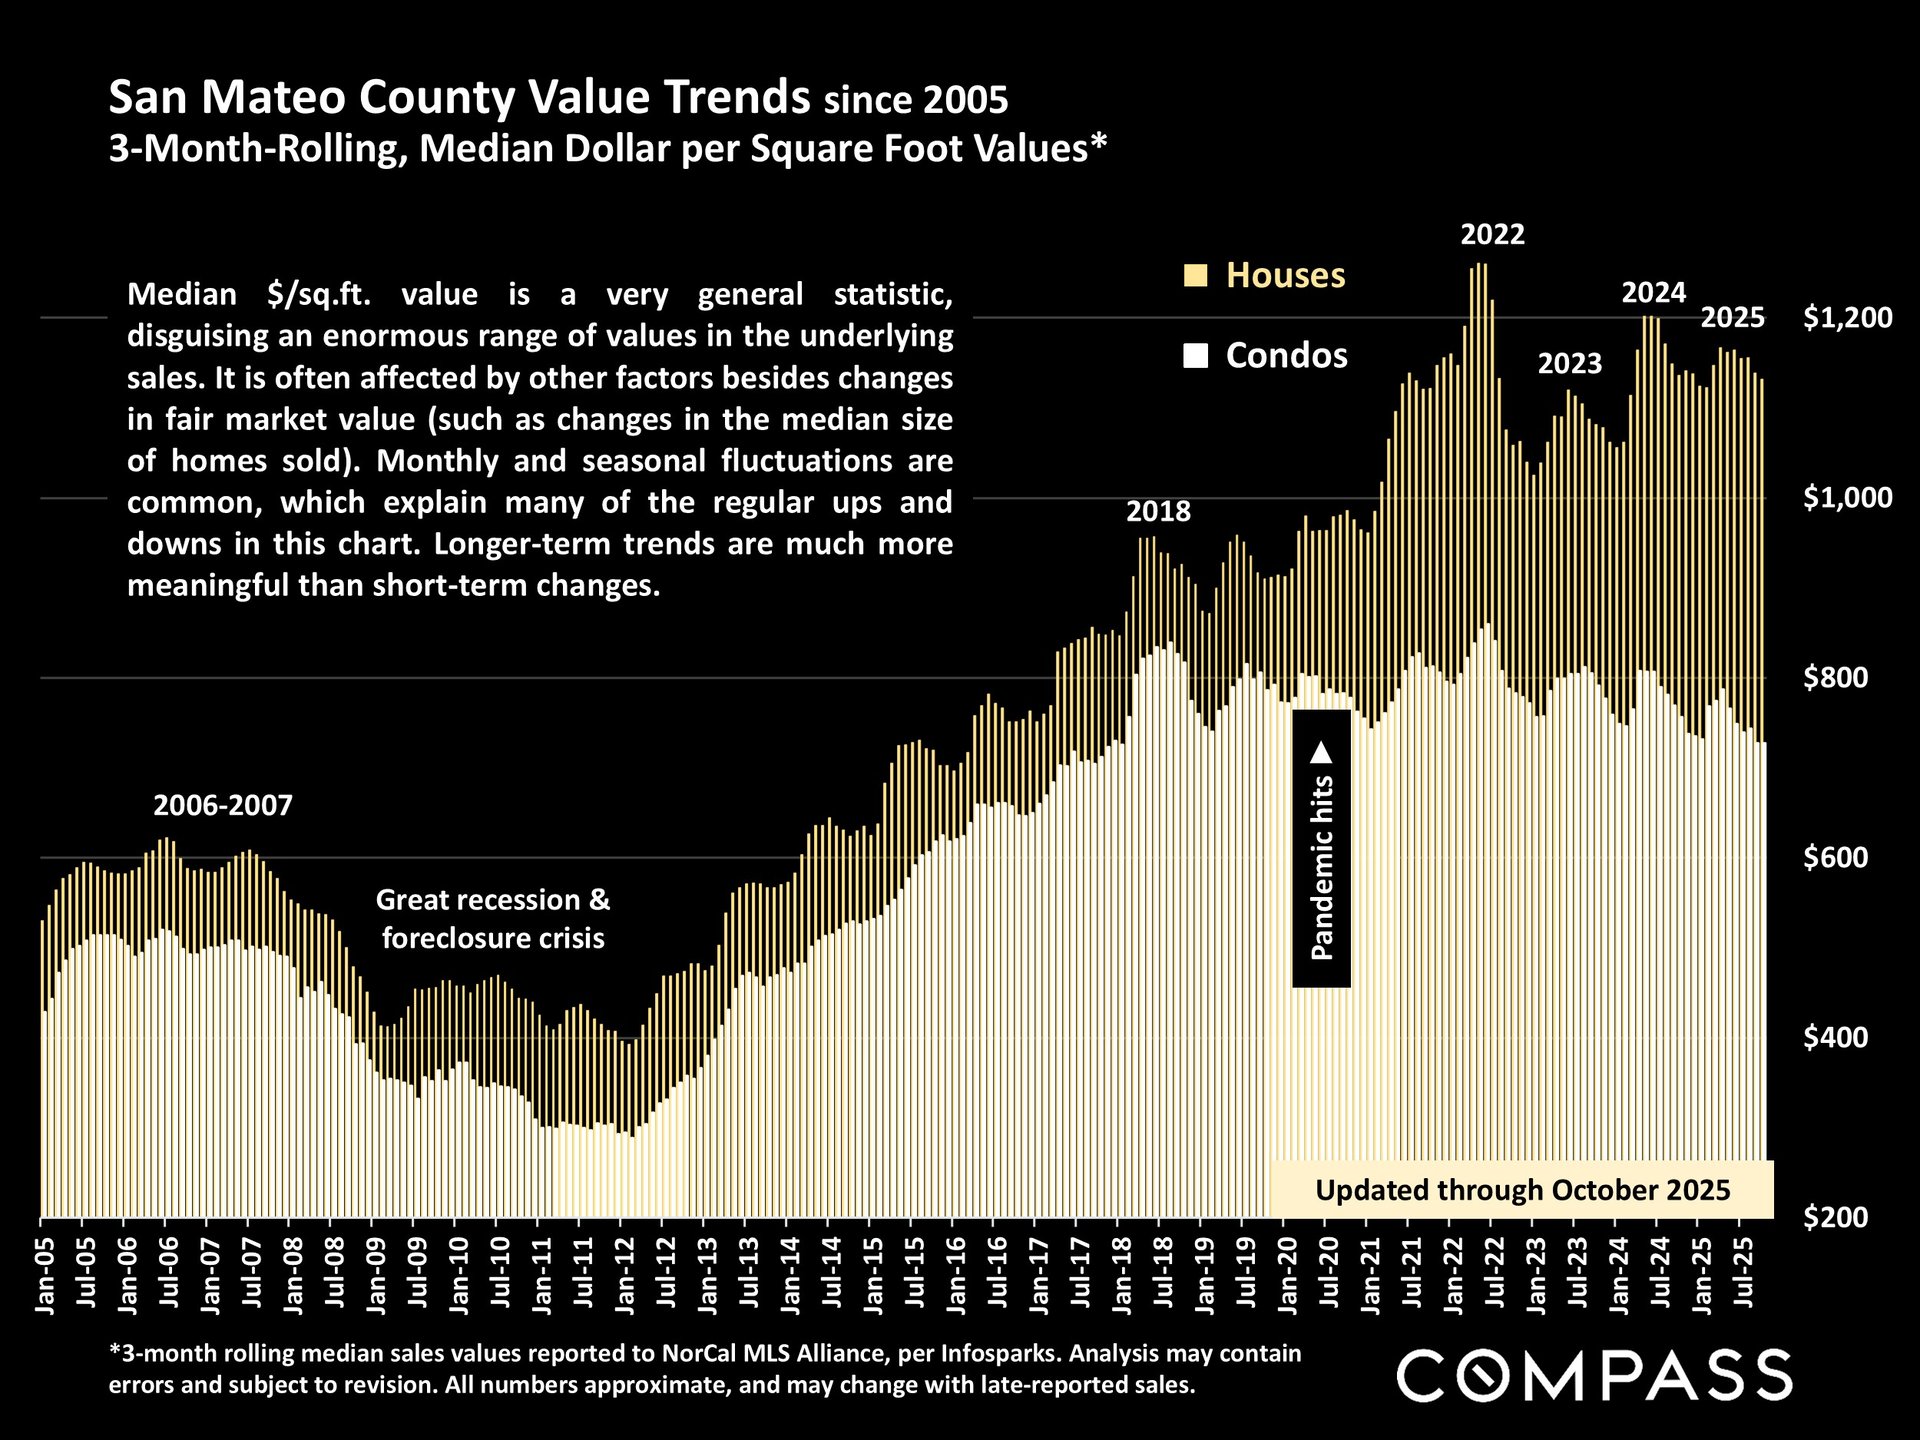
Chart of San Mateo County house and condo values per square foot, 2005–2025, updated through October 2025.

Santa Clara County condo and townhouse median sales price chart, 2005–2025, updated through October 2025.

Sales Volume (Nov 2025 vs. Nov 2024)

• San Mateo: –3.5%
• Santa Clara: –8%
• Alameda: –10%

Bar chart of Santa Clara County monthly home sales, January 2021–October 2025, with October 2025 sales update.

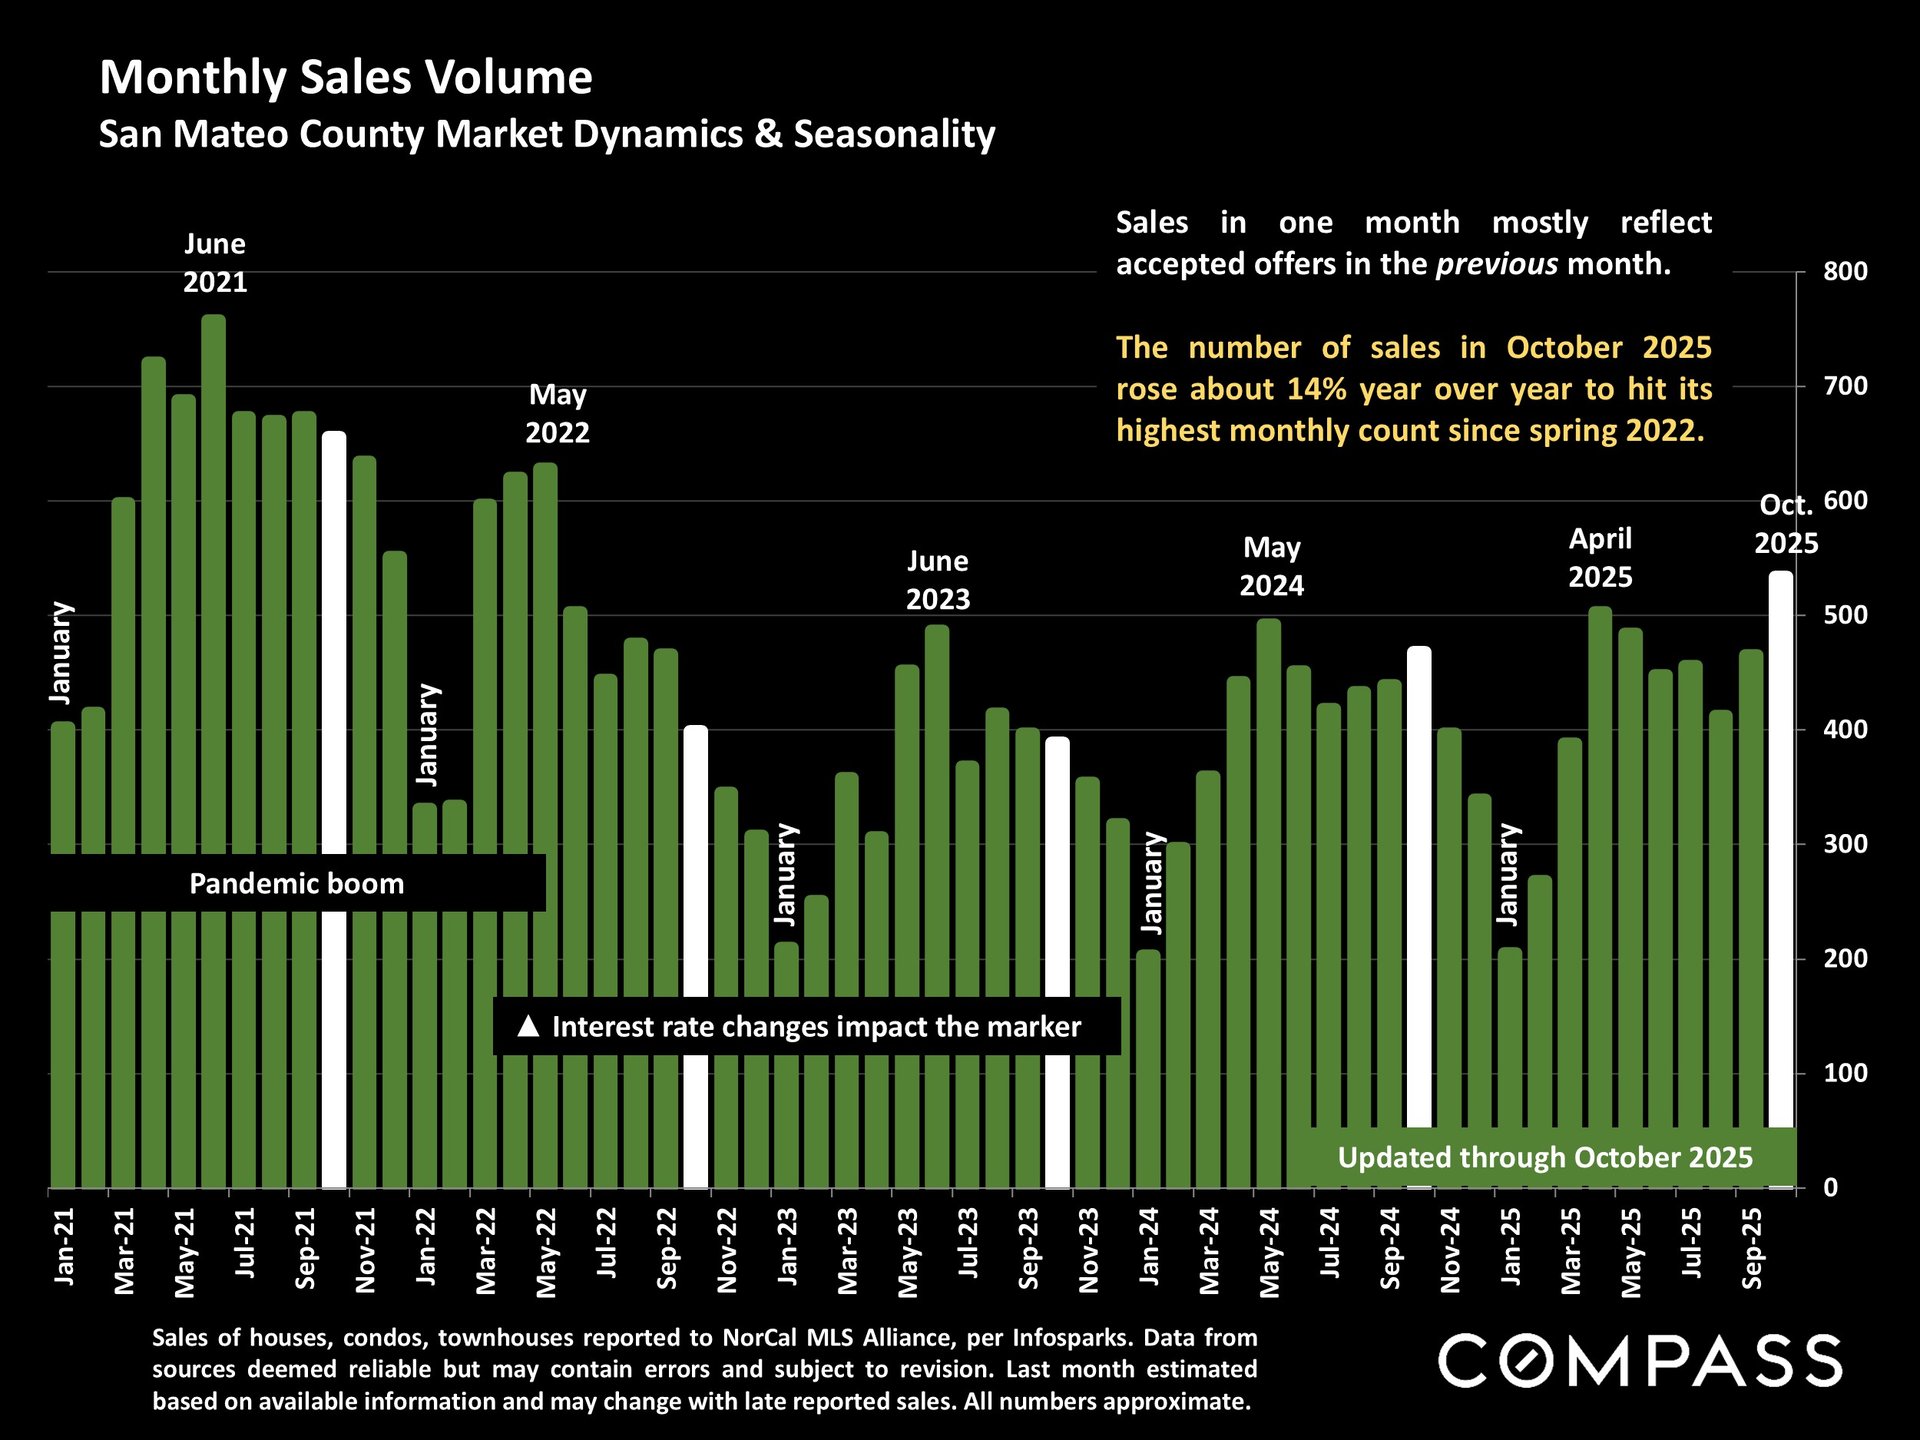
San Mateo County monthly home sales chart, January 2021–October 2025, highlighting October’s year-over-year increase.

Bar chart of monthly home sales in the Tri-Valley and South Alameda County, January 2021 to October 2025.

New Listings (Nov 2025 vs. Nov 2024)

• San Mateo: +7%
• Santa Clara: +9%
• Alameda: +11%
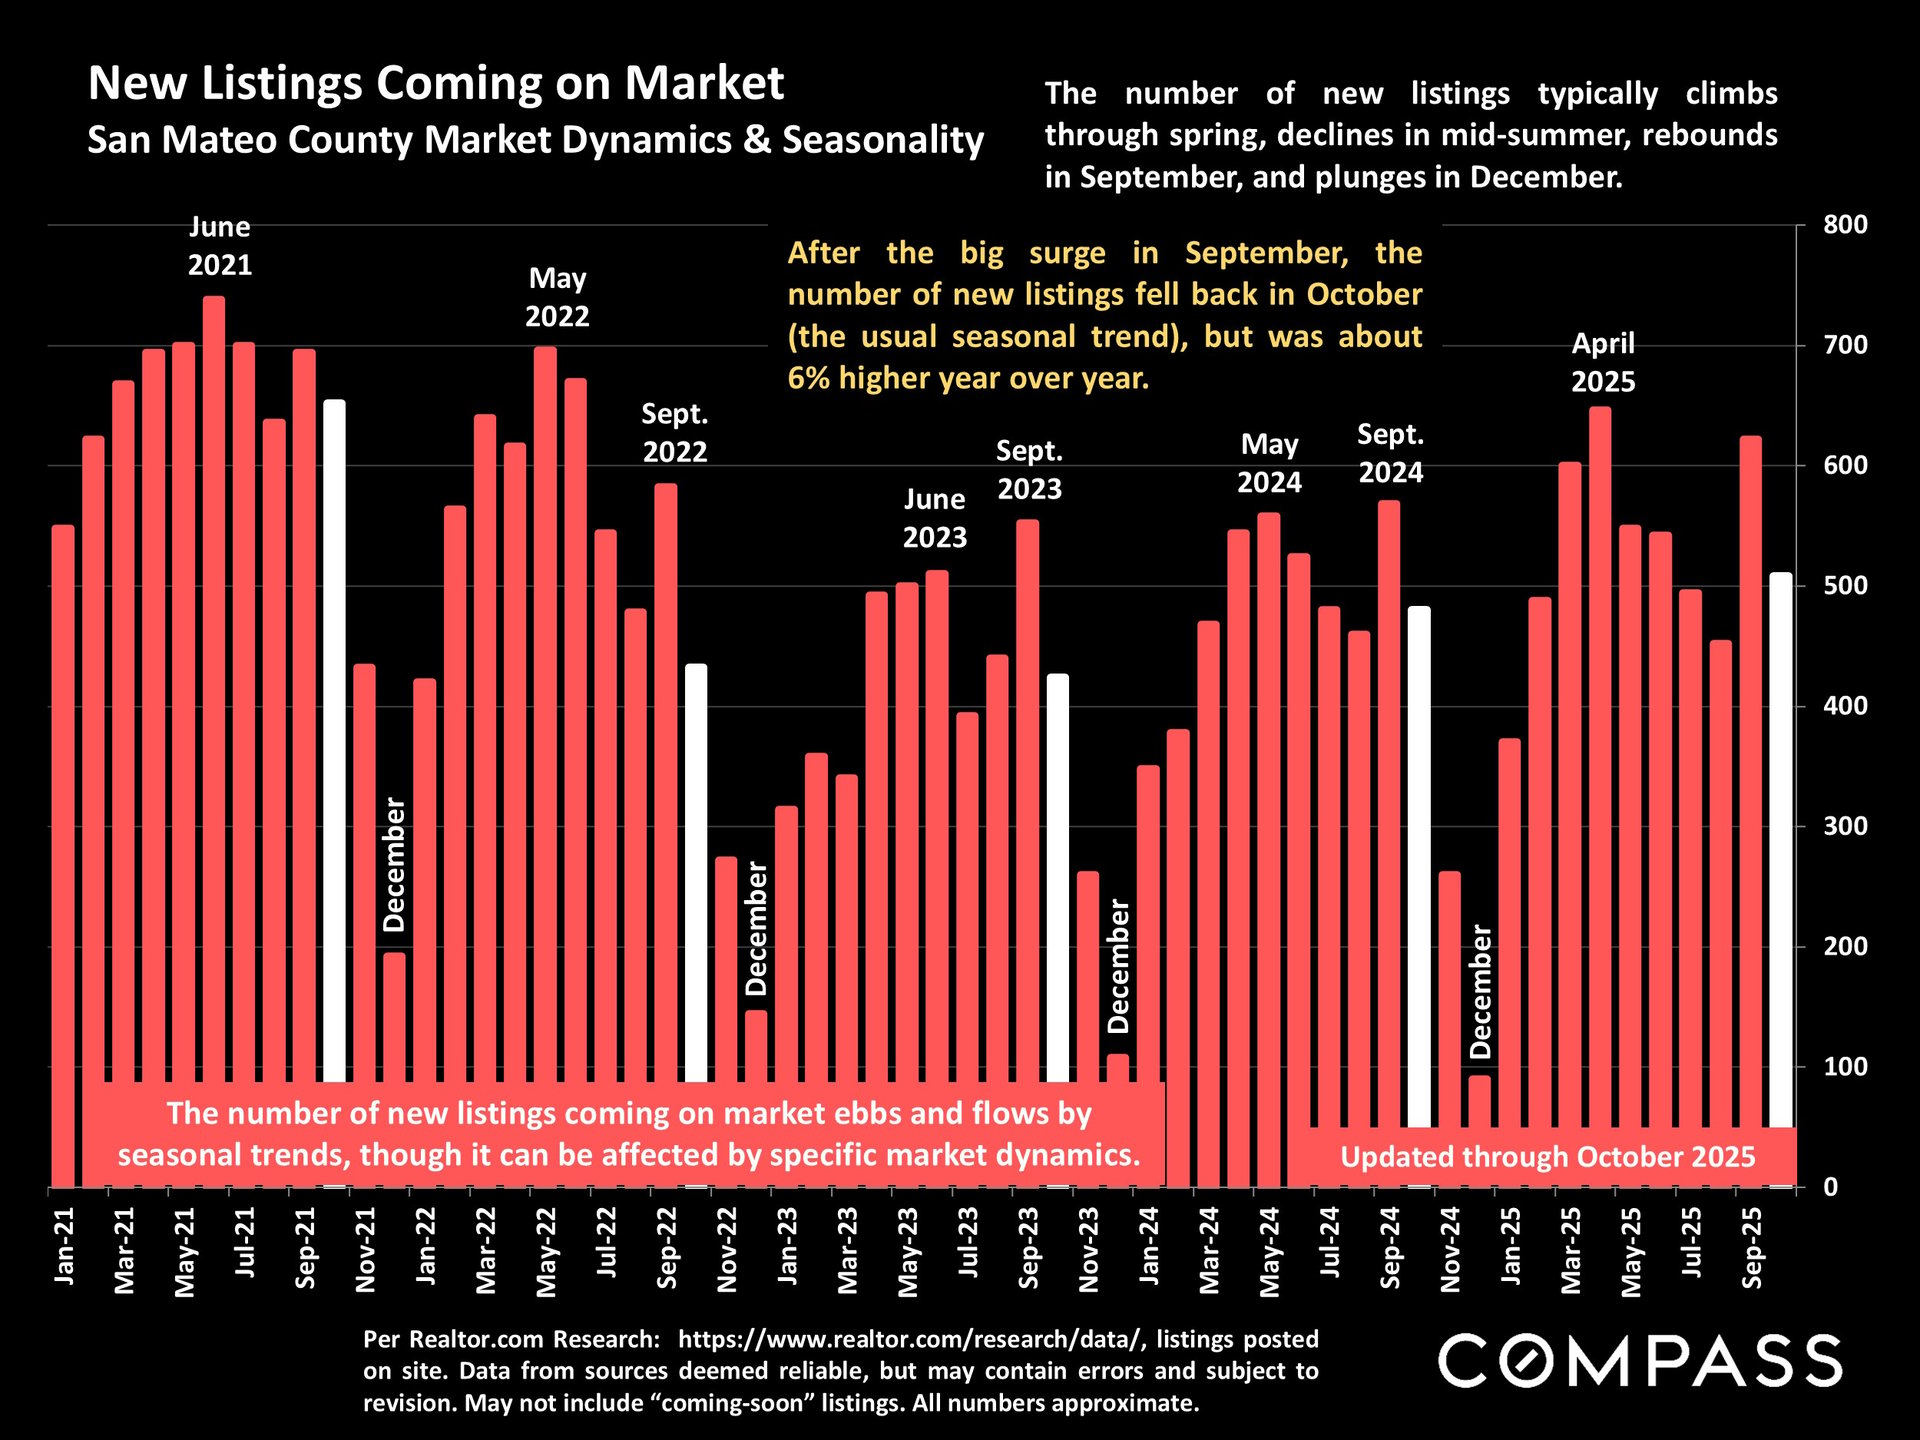
Bar chart of San Mateo County monthly new listings, January 2021 to October 2025, showing seasonal peaks and December declines.

Santa Clara County monthly new listings chart, January 2021 to October 2025, with October listings down 6.5% year over year.

Active Listings (Nov 2025 vs. Nov 2024)

• San Mateo: +14%
• Santa Clara: +18%
• Alameda: +19%
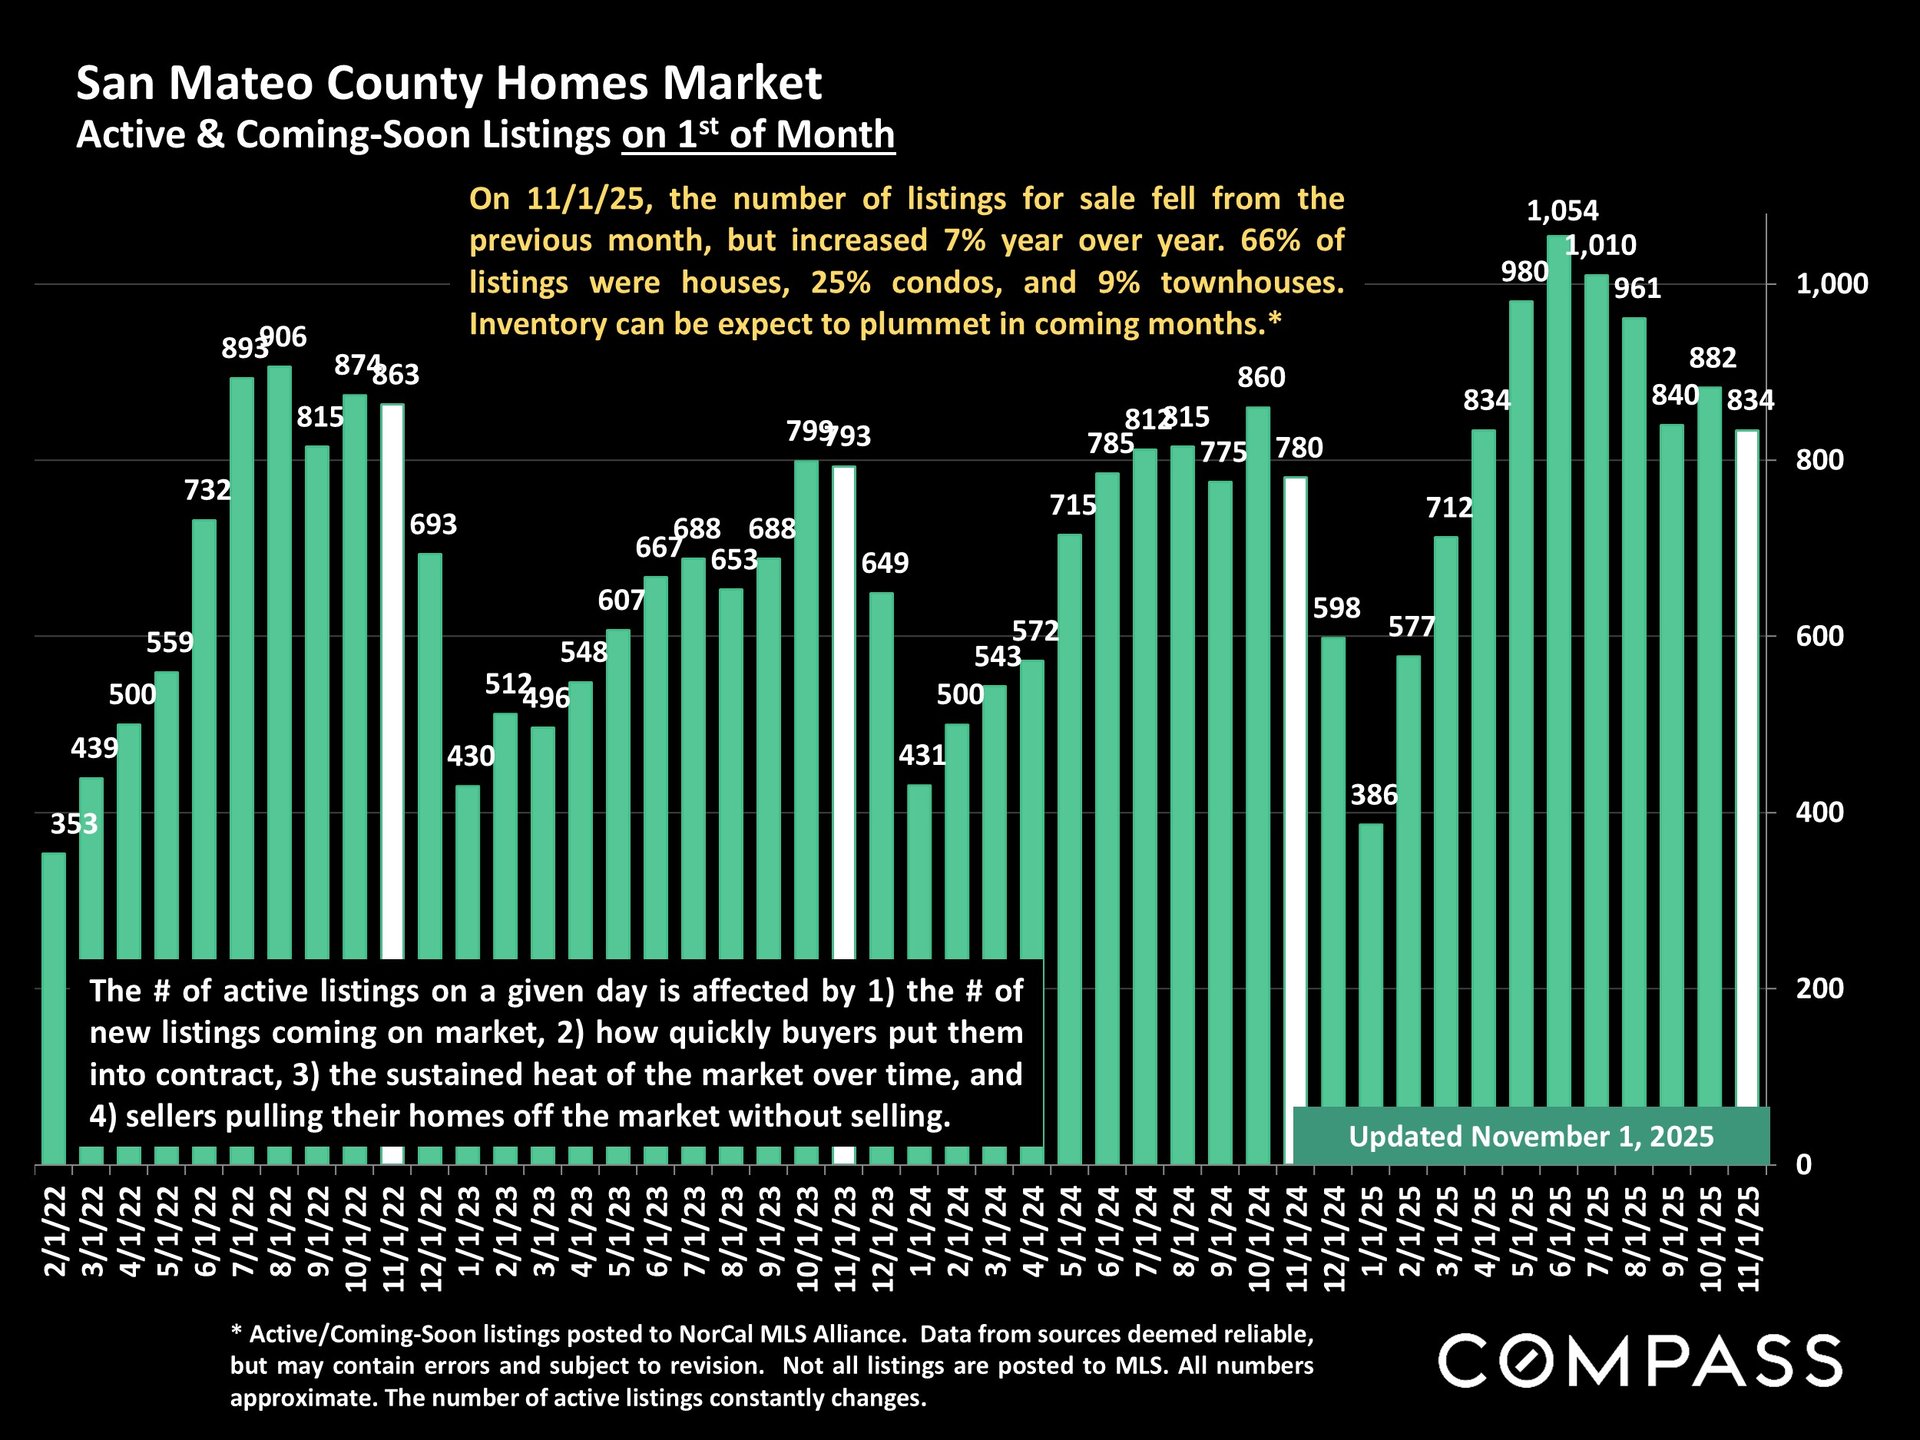
San Mateo County active and coming-soon listing counts, charted monthly from February 2022 through November 2025.

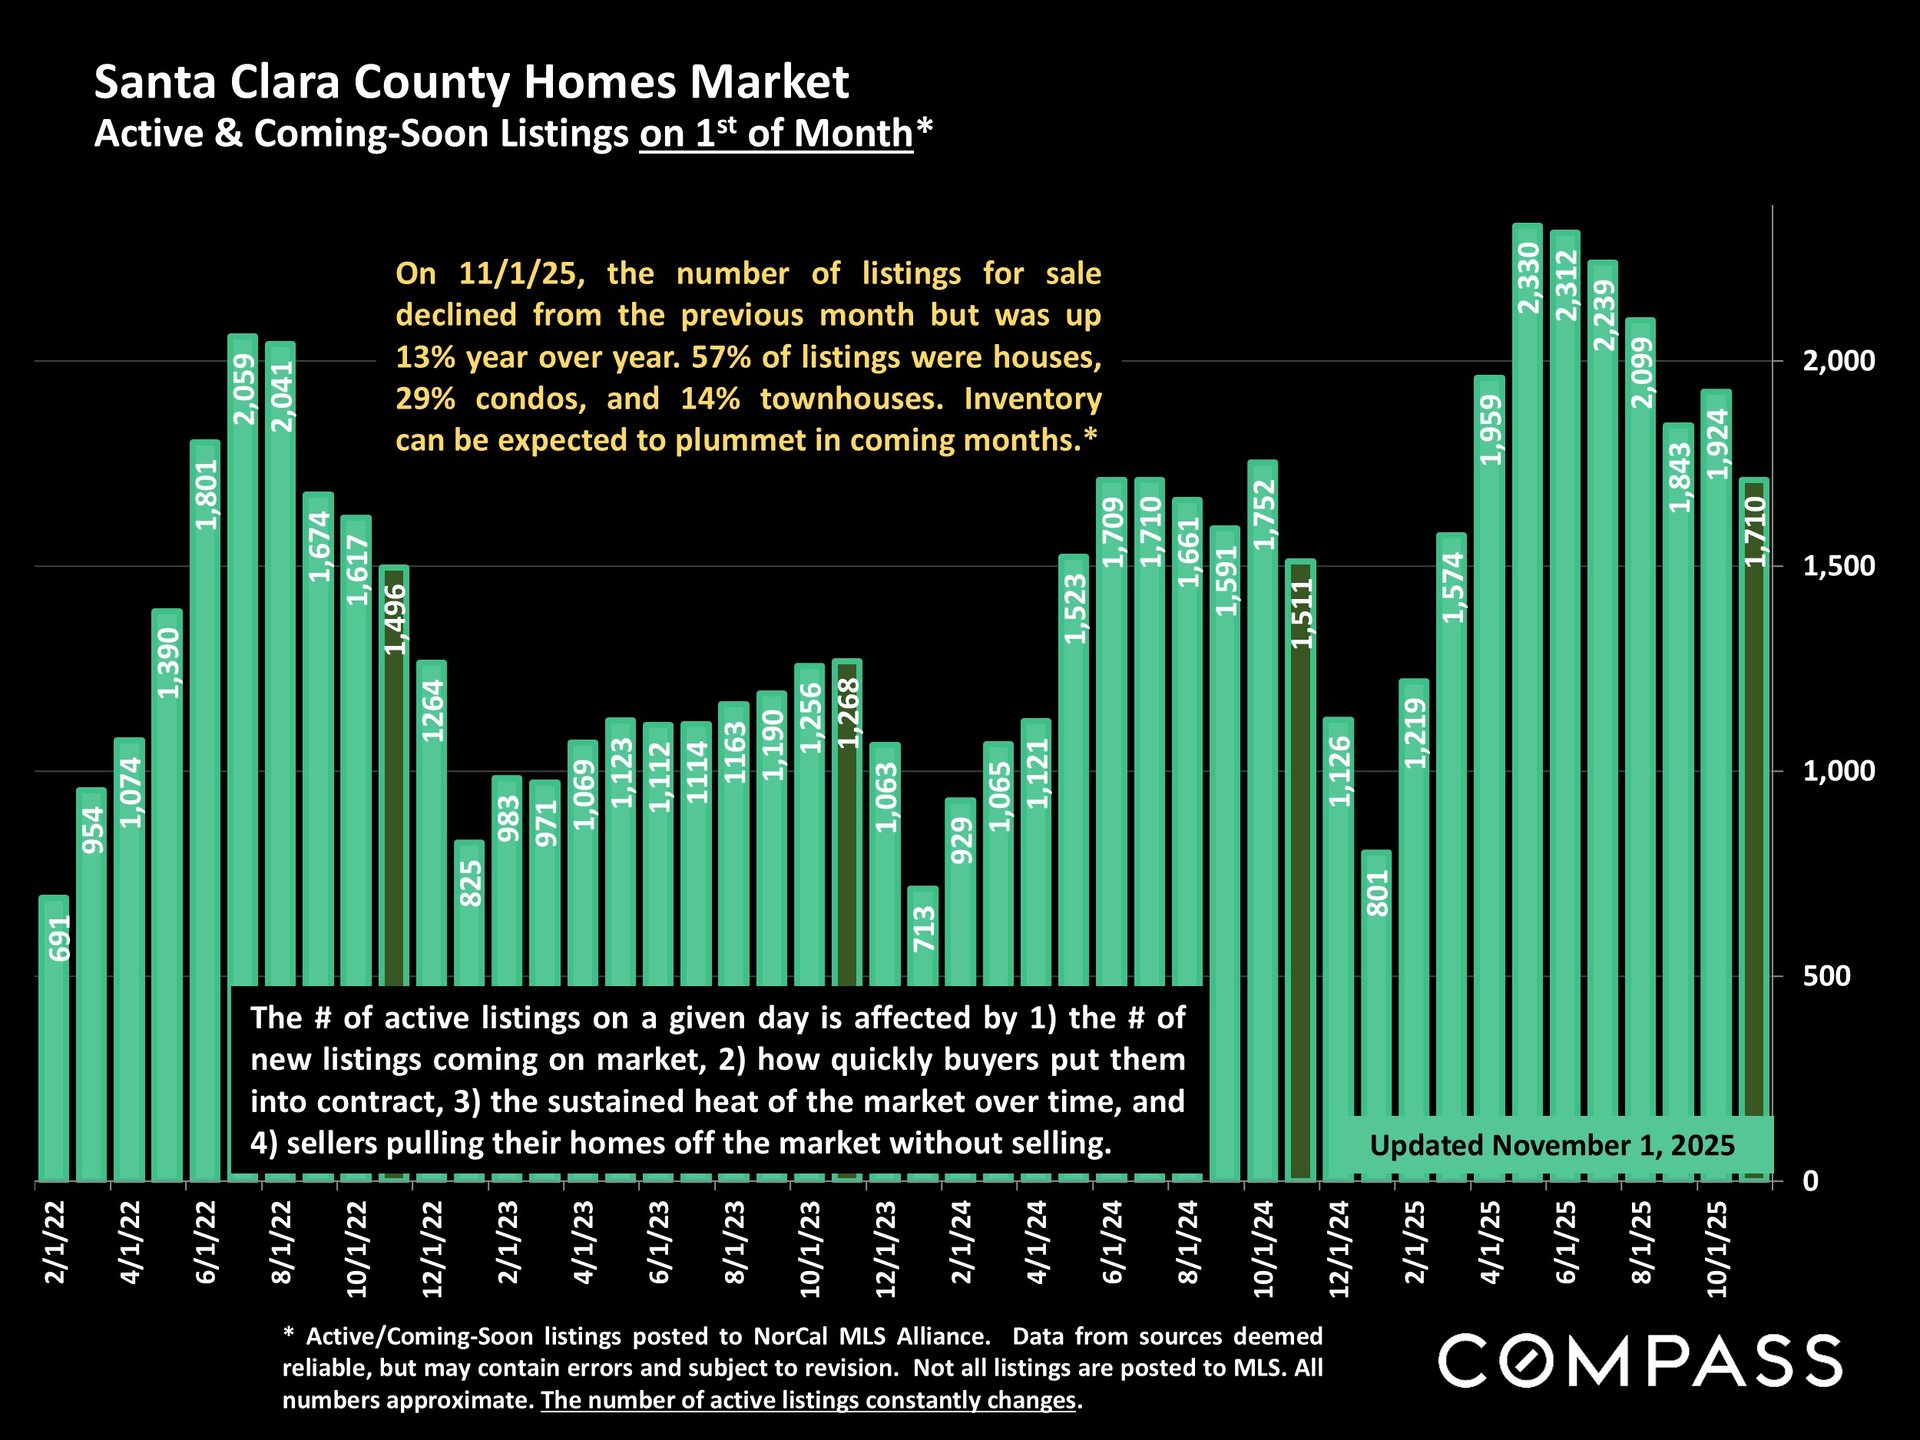
Santa Clara County active and coming-soon listings chart, with monthly counts from 2022 to 2025 and a November 2025 market summary.

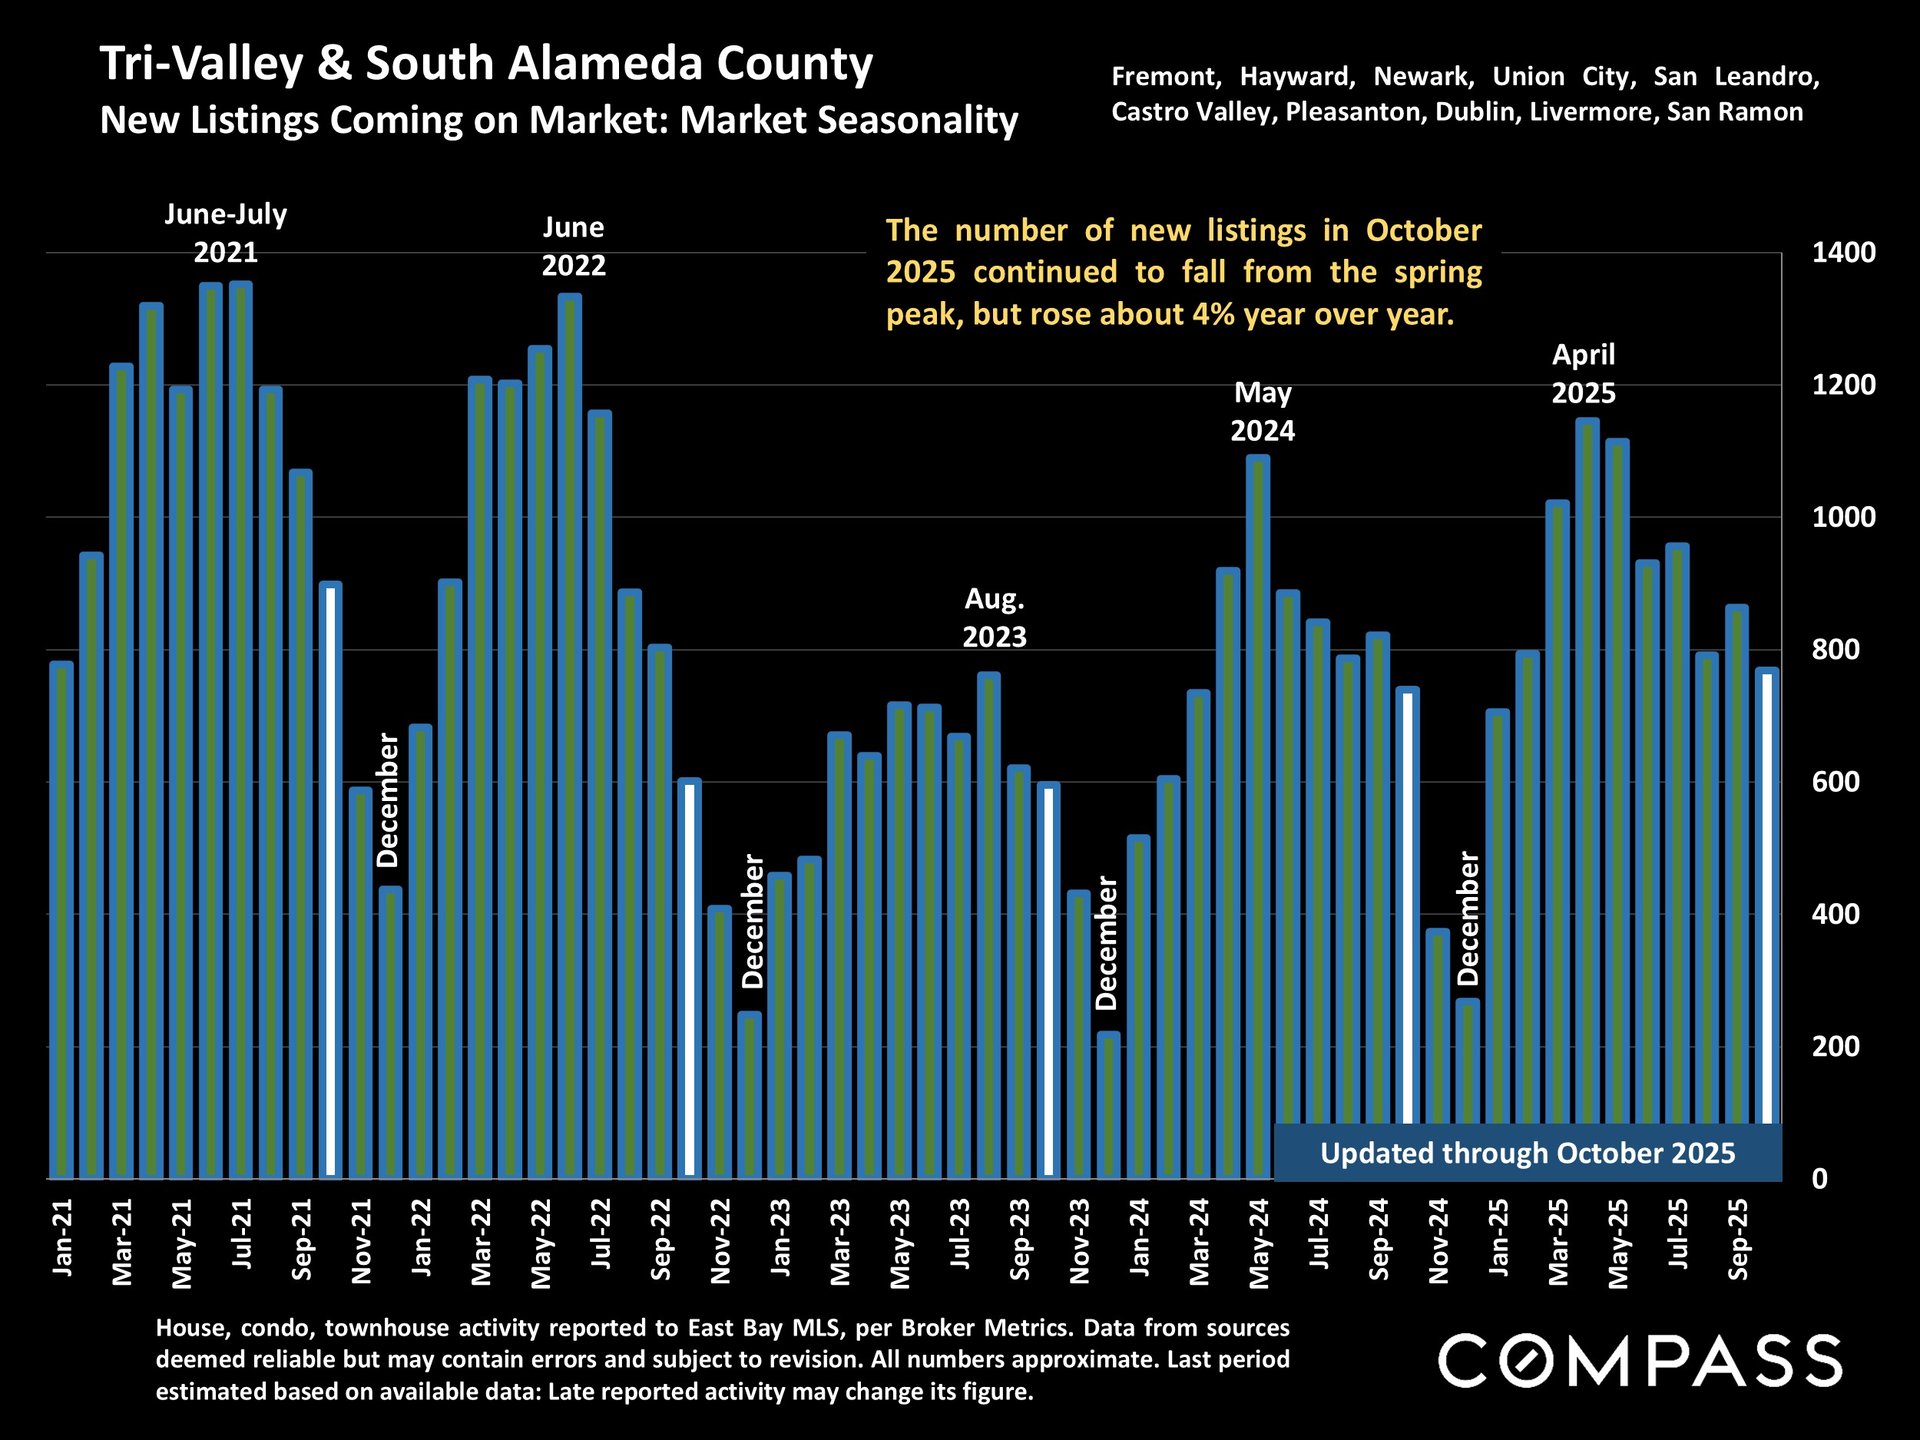
Bar chart of Tri-Valley and South Alameda County new listings, January 2021–October 2025; October listings rose 4% year over year.

Listings Accepting Offers (Nov 2025 vs. Nov 2024)

• San Mateo: –8%
• Santa Clara: –10%
• Alameda: –12%
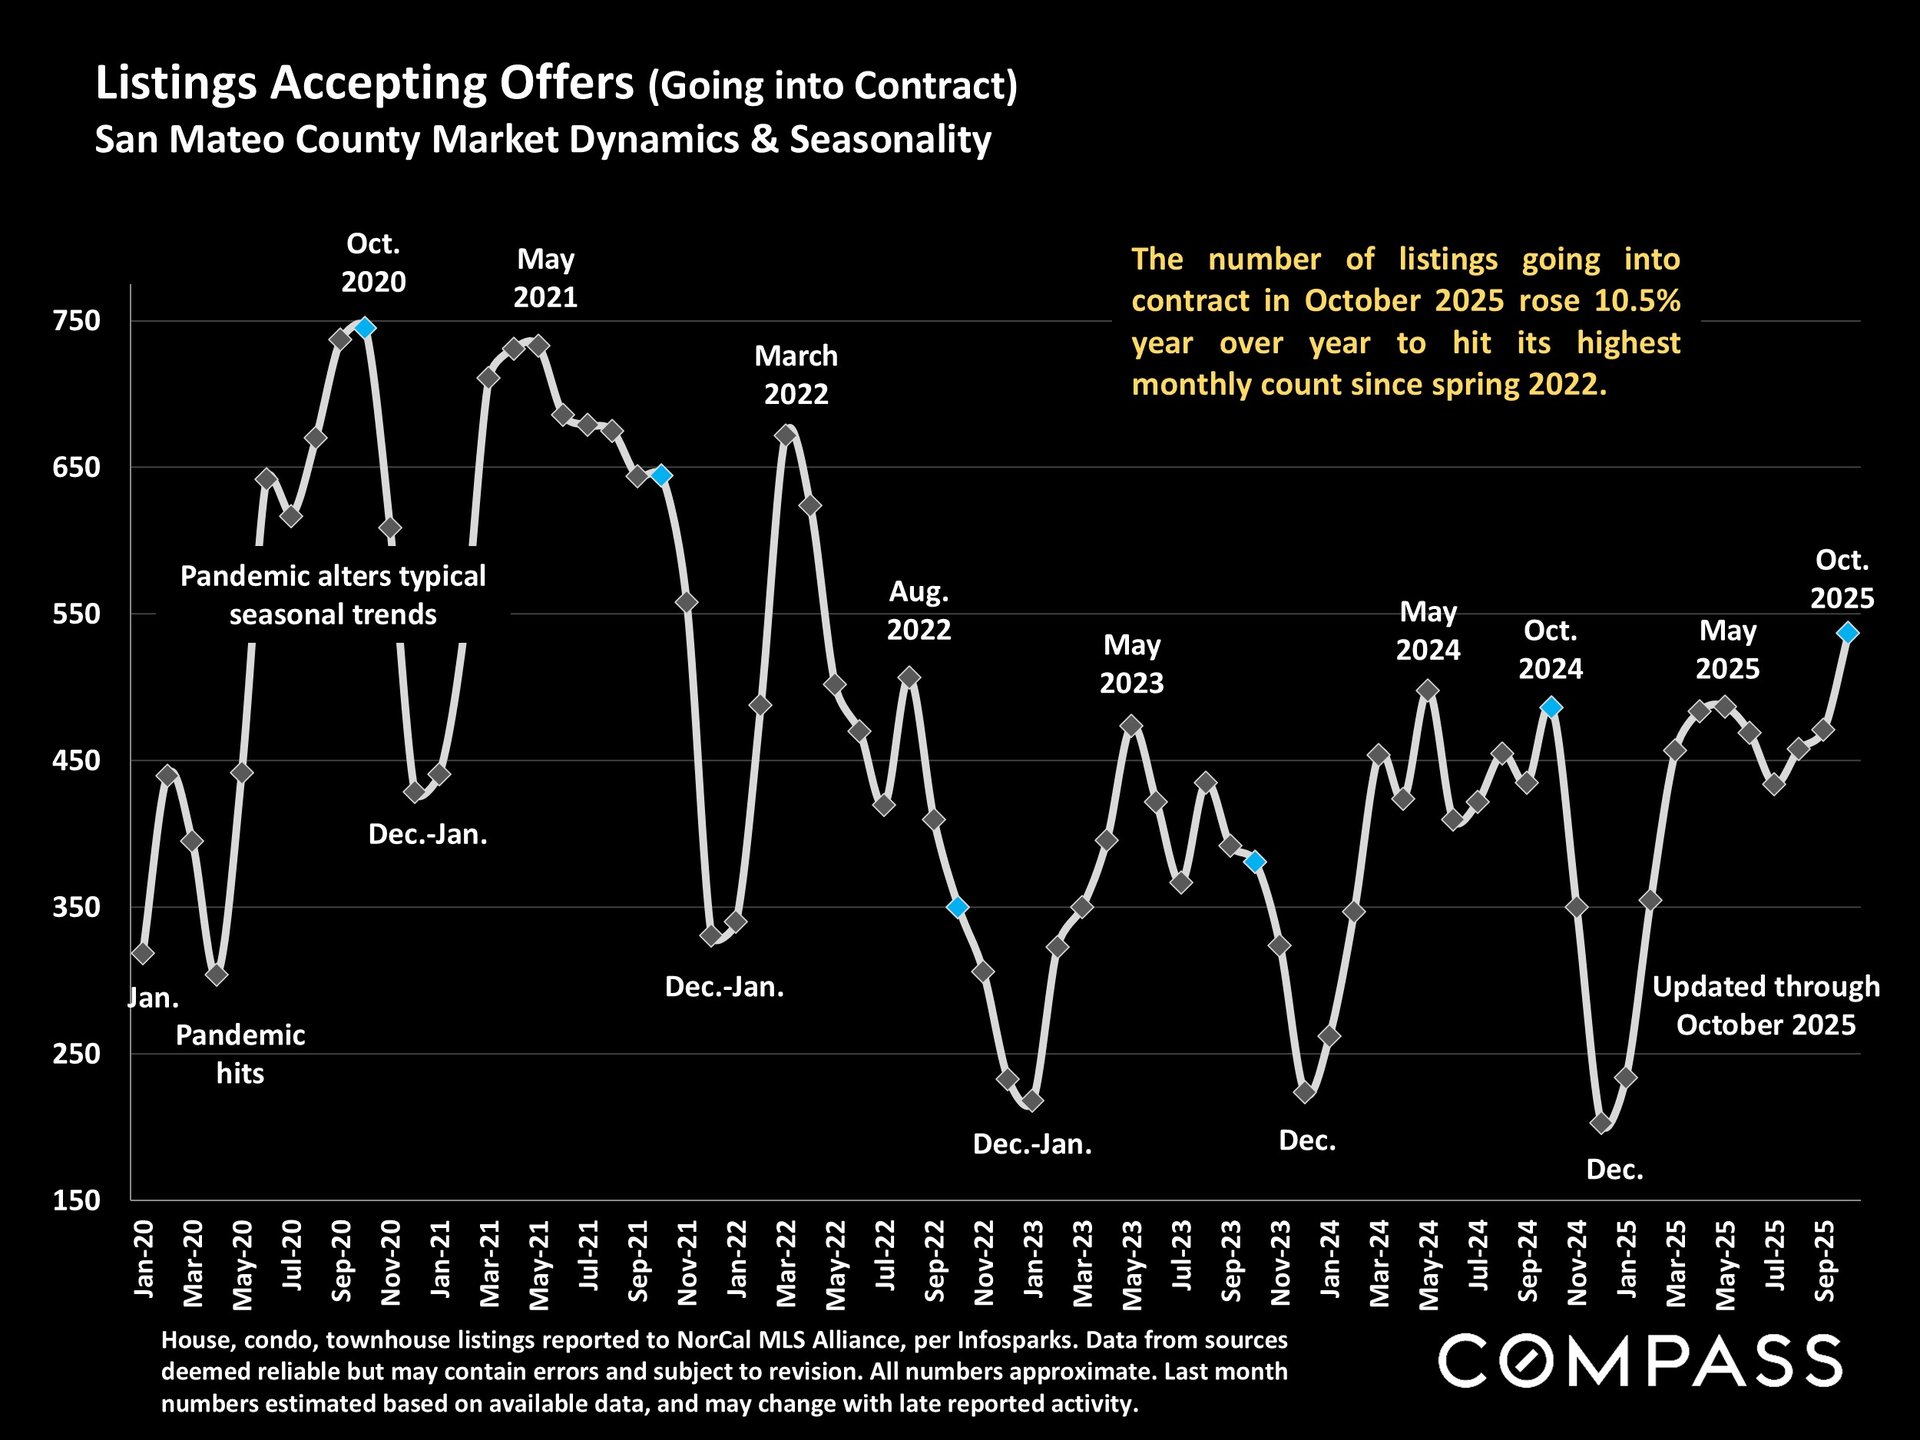
Line chart of San Mateo County listings going under contract, with October 2025 counts highest since spring 2022.

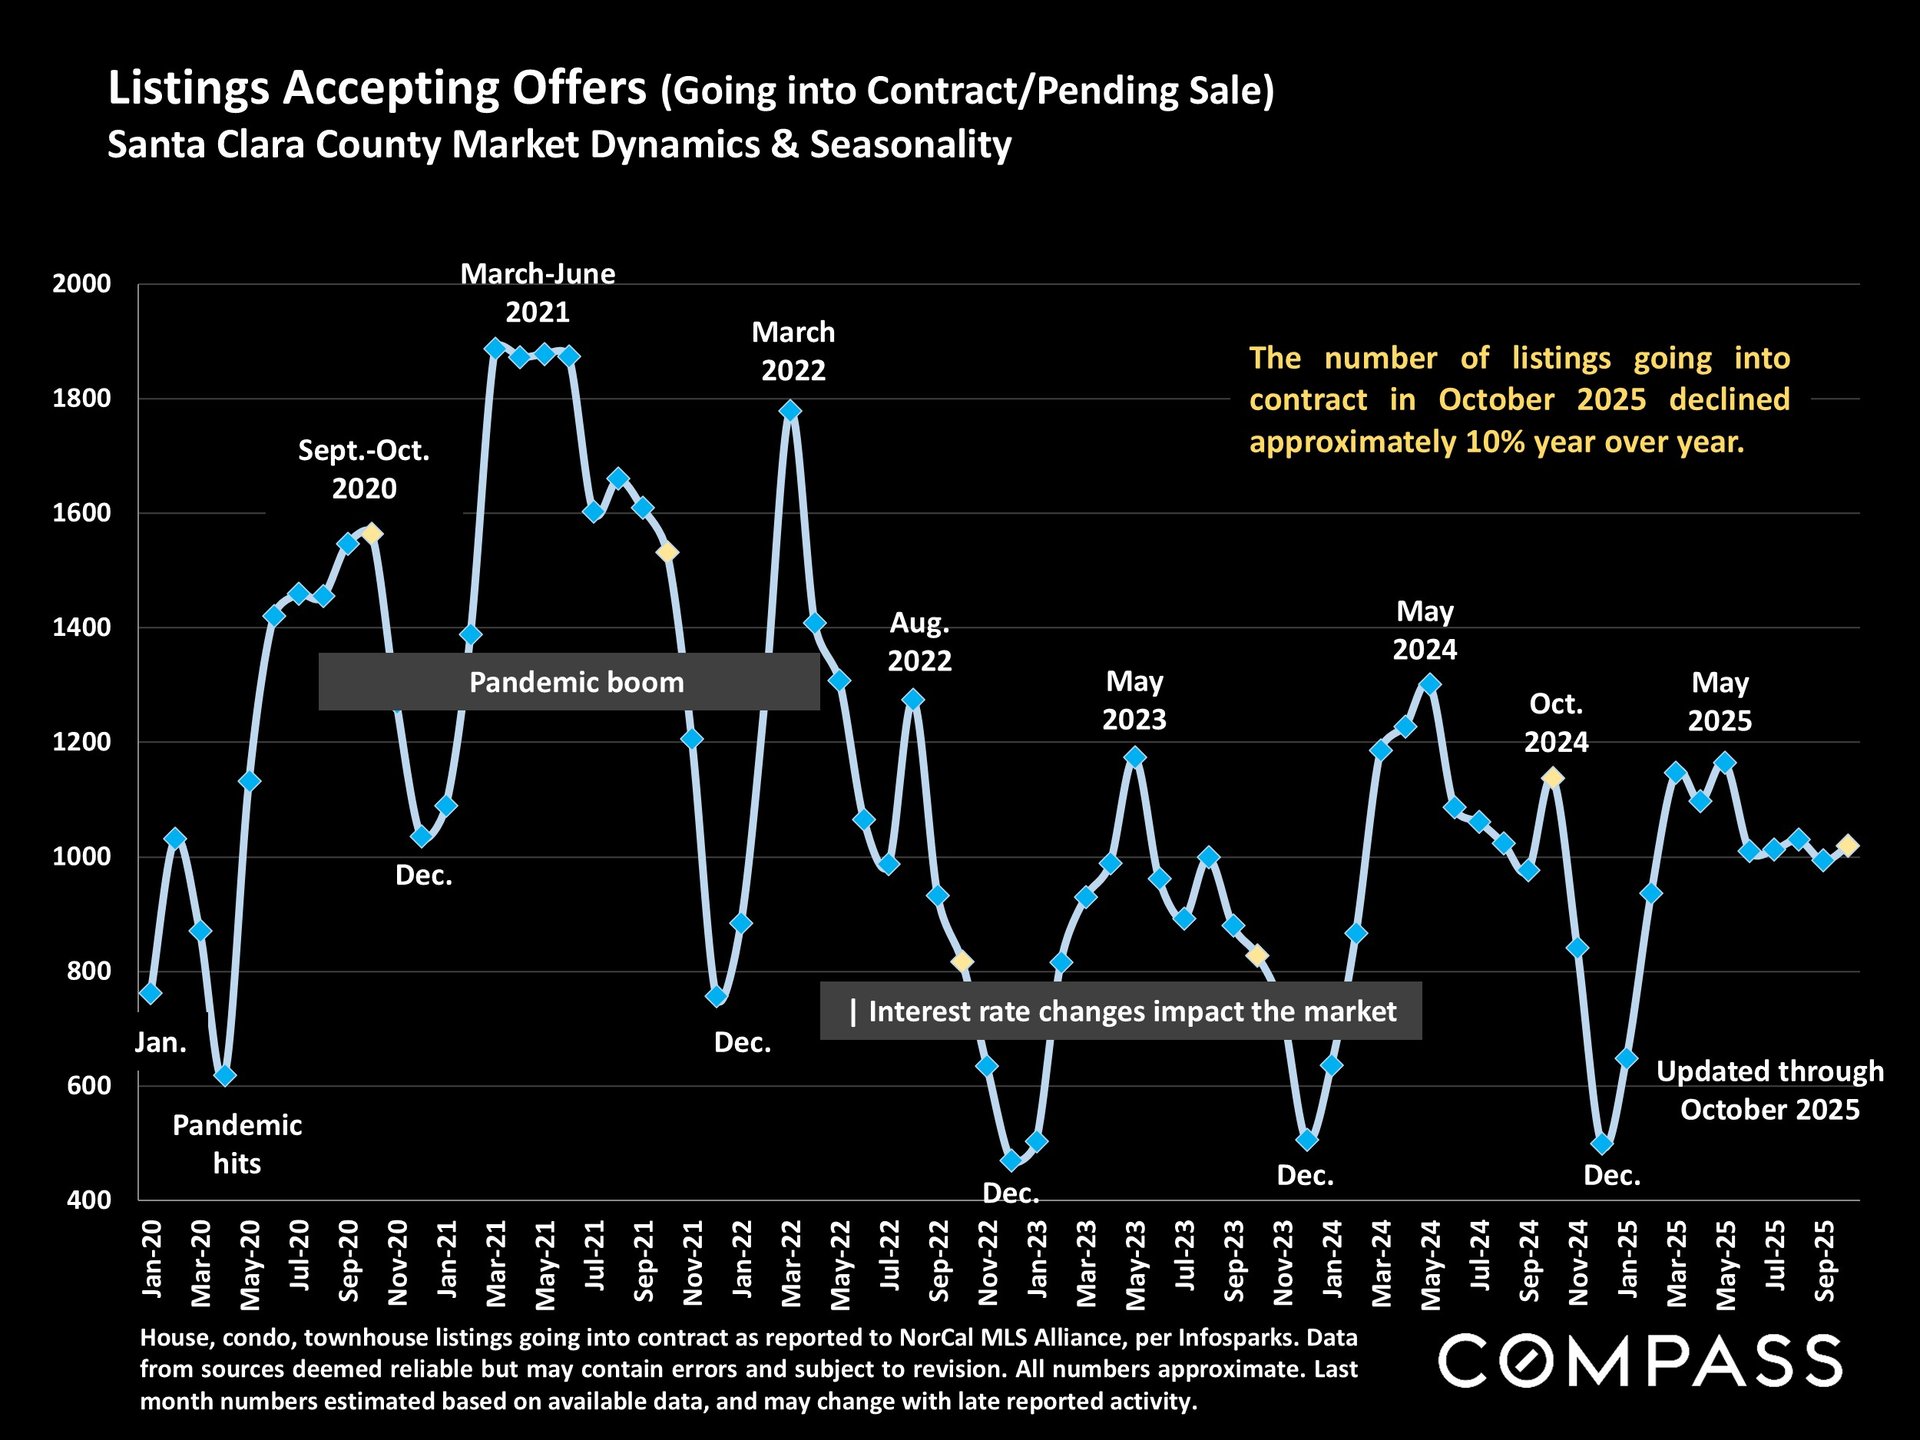
Santa Clara County pending-sale listings chart, showing monthly trends from 2020 through October 2025.

Price Reductions (Nov 2025 vs. Nov 2024)

• San Mateo: +31%
• Santa Clara: +40%
• Alameda: +45%
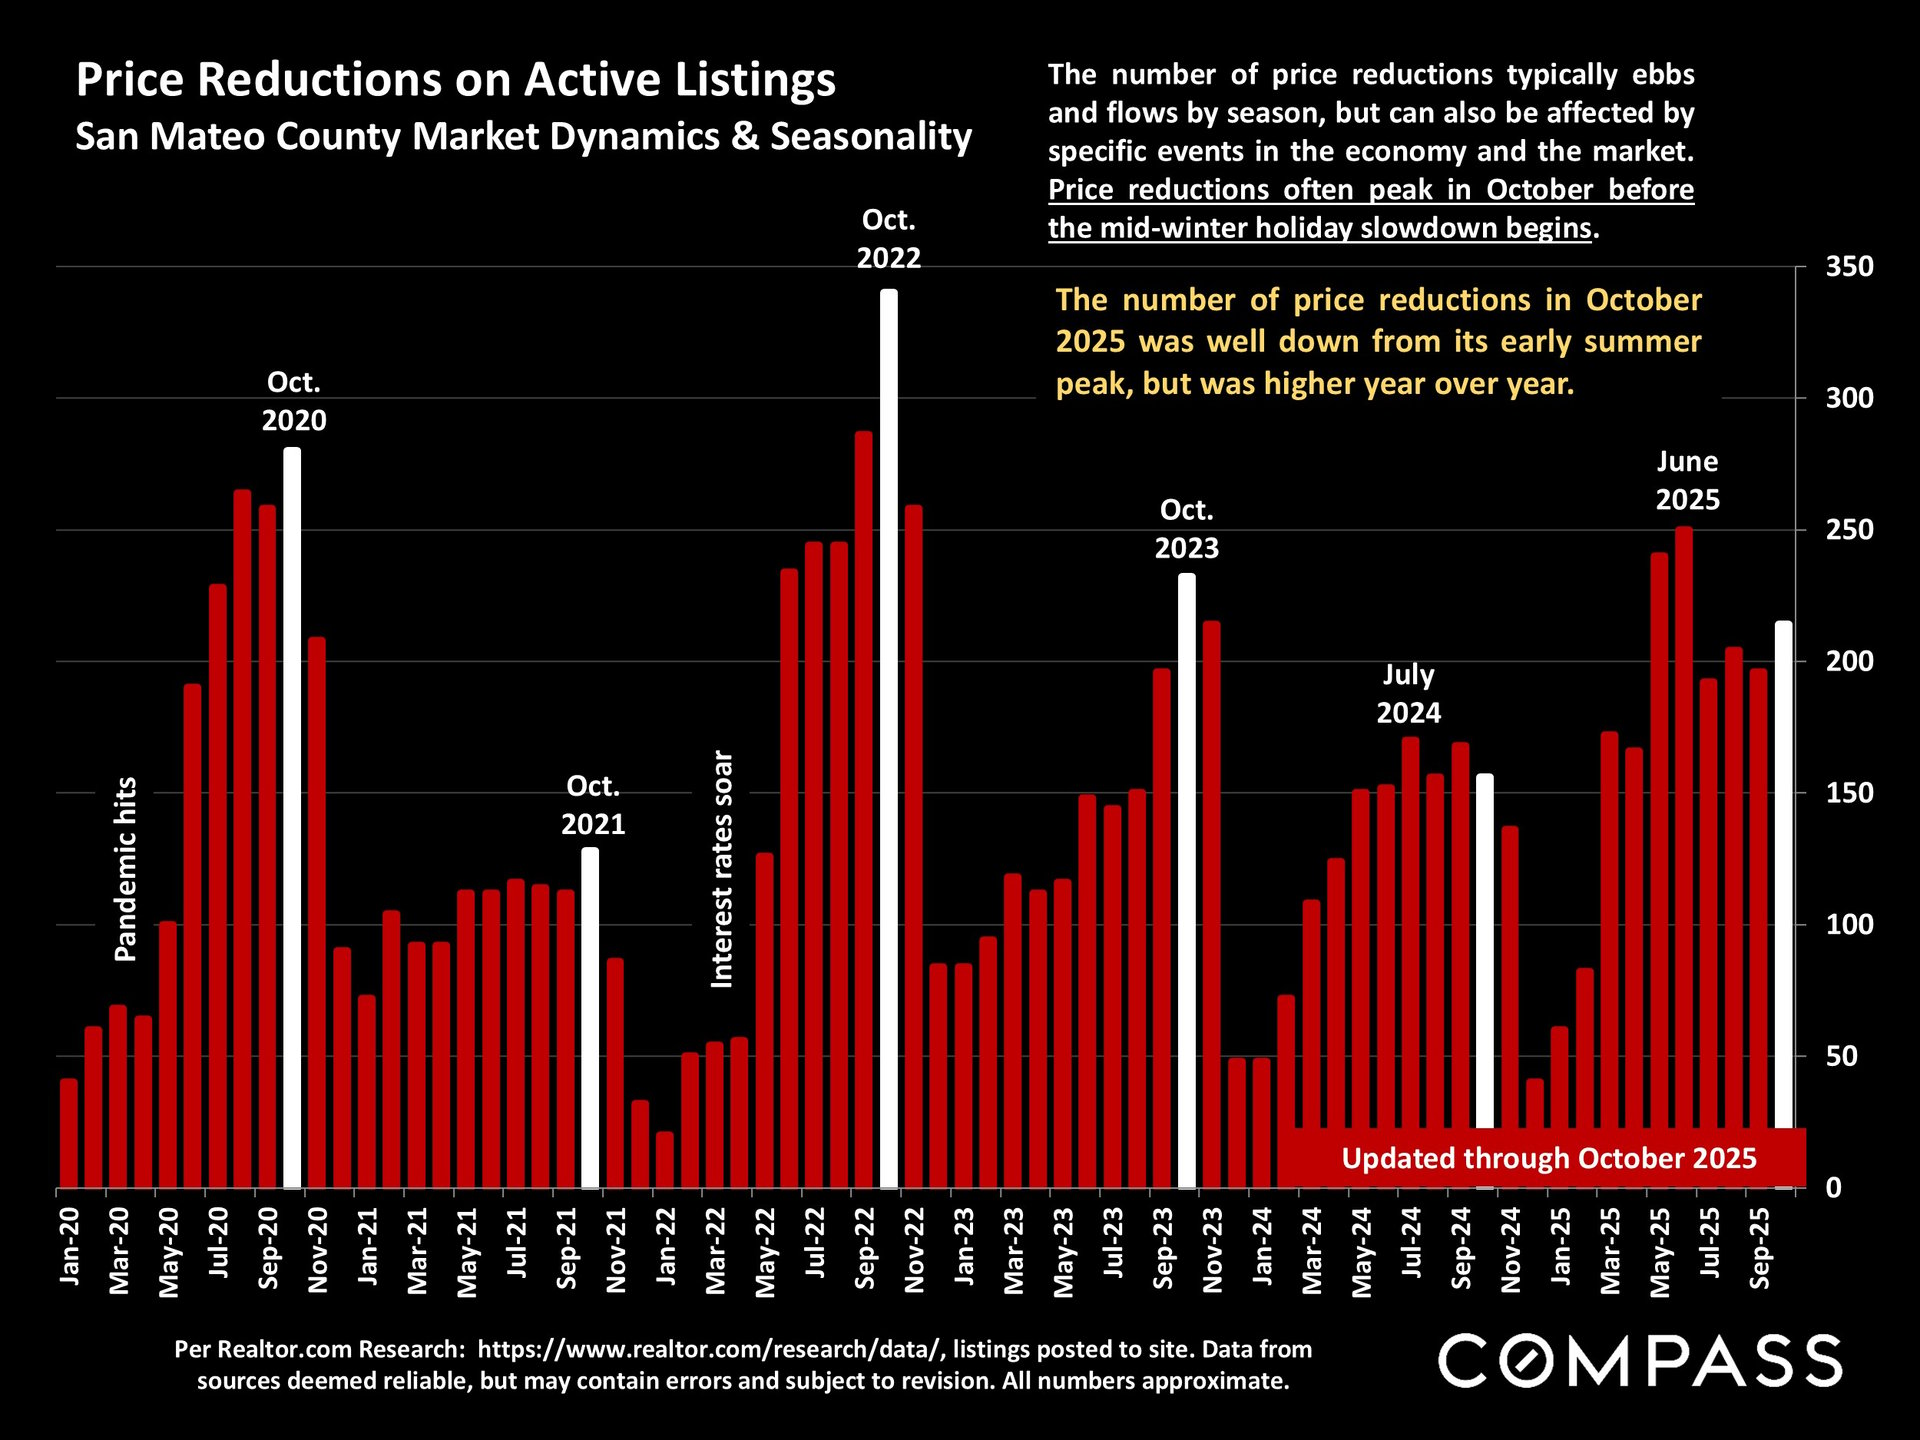
Chart of San Mateo County active-listing price reductions from 2020 to October 2025, with selected months highlighted.

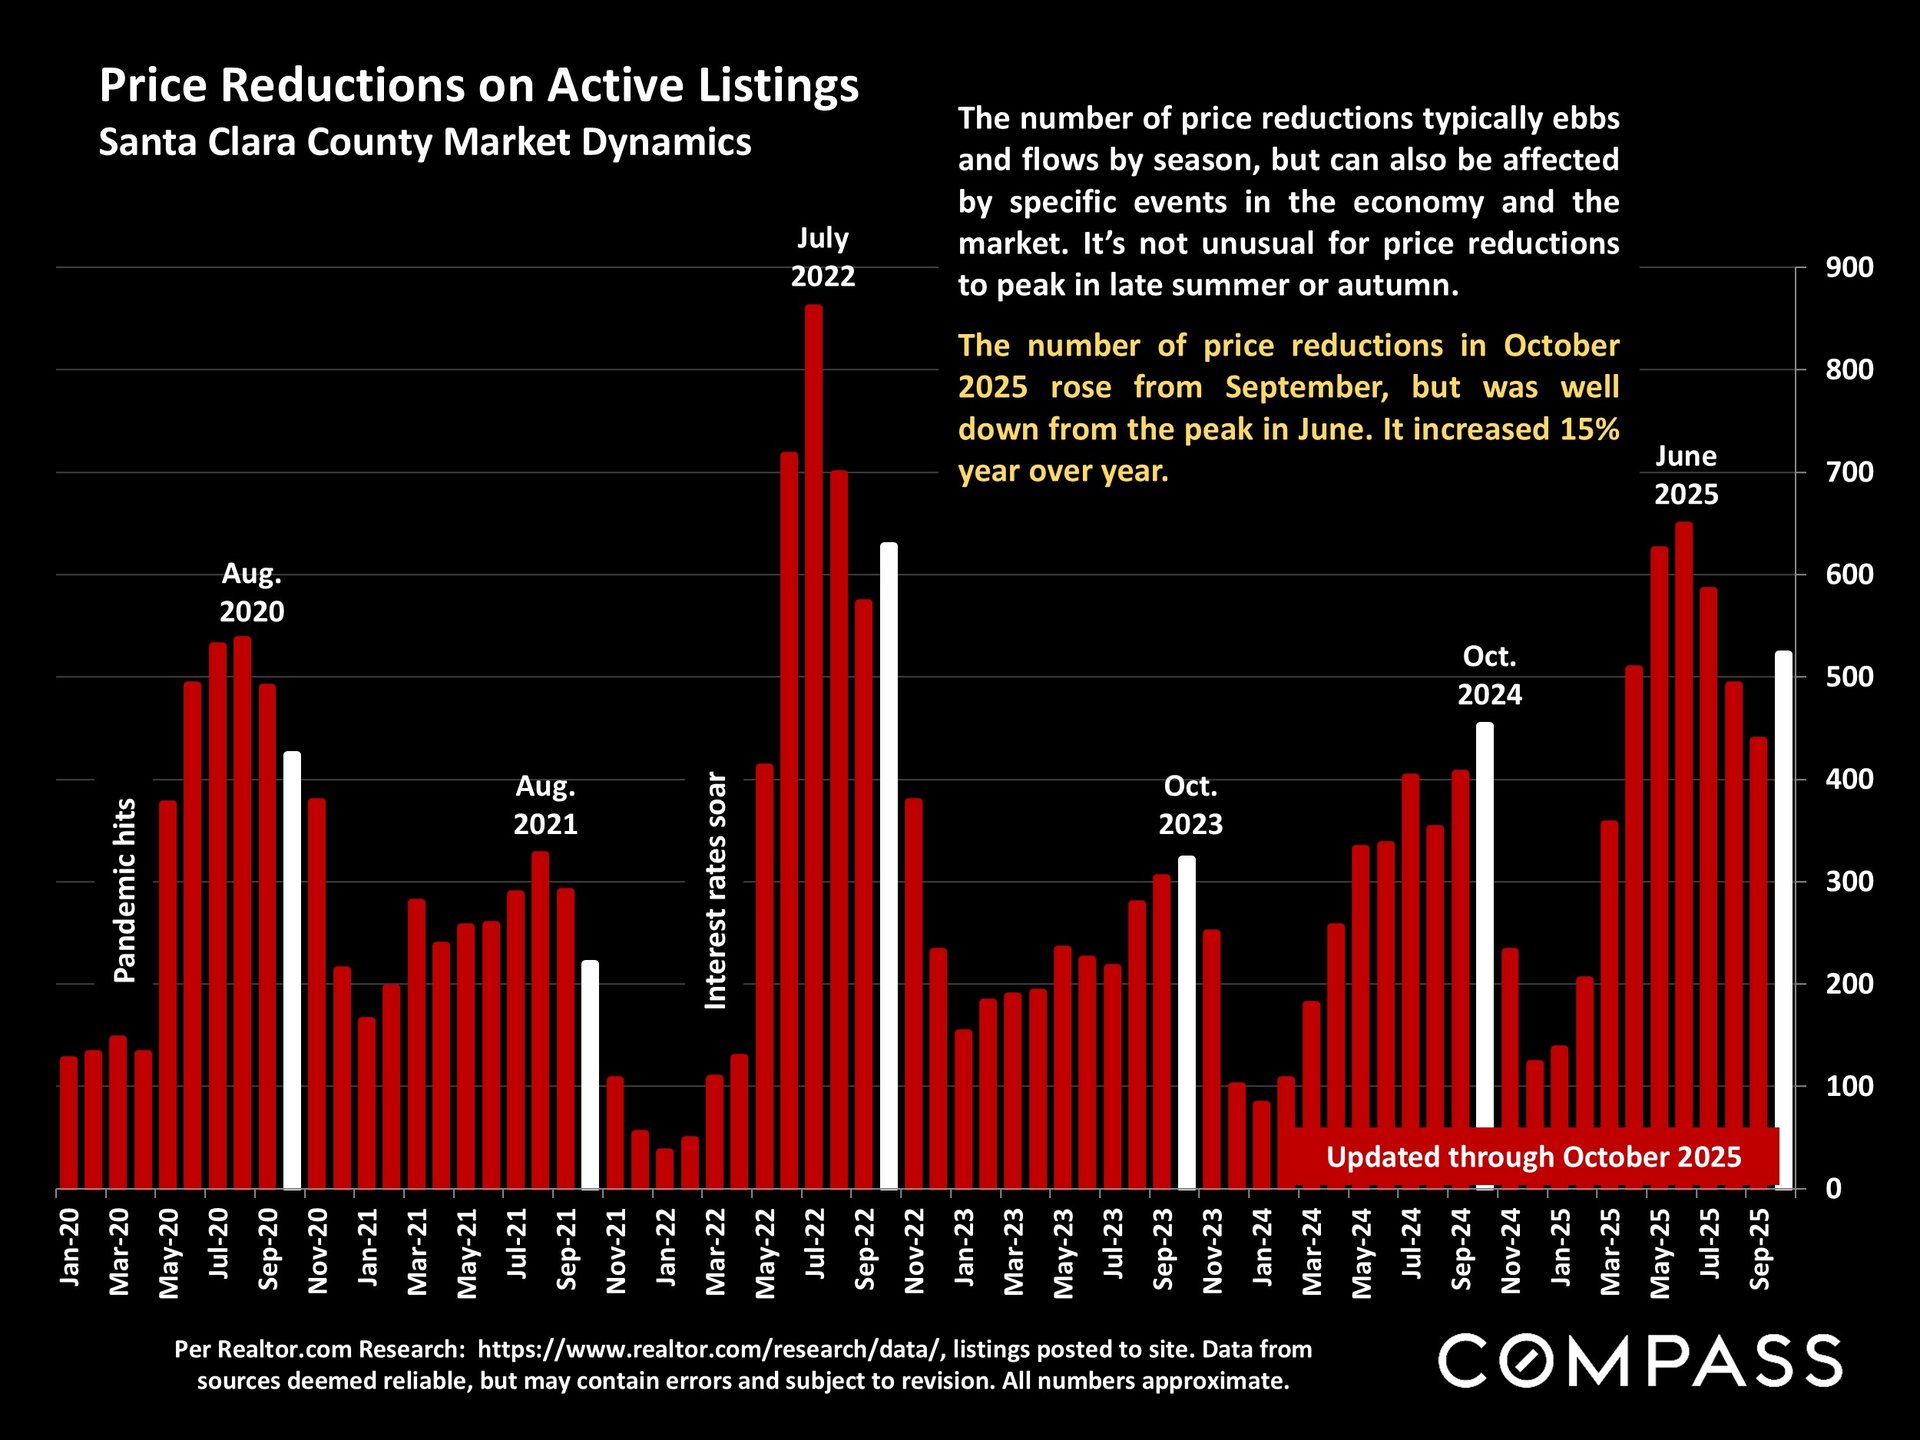
Bar chart of Santa Clara County active-listing price reductions, January 2020–October 2025, with a June 2025 peak.

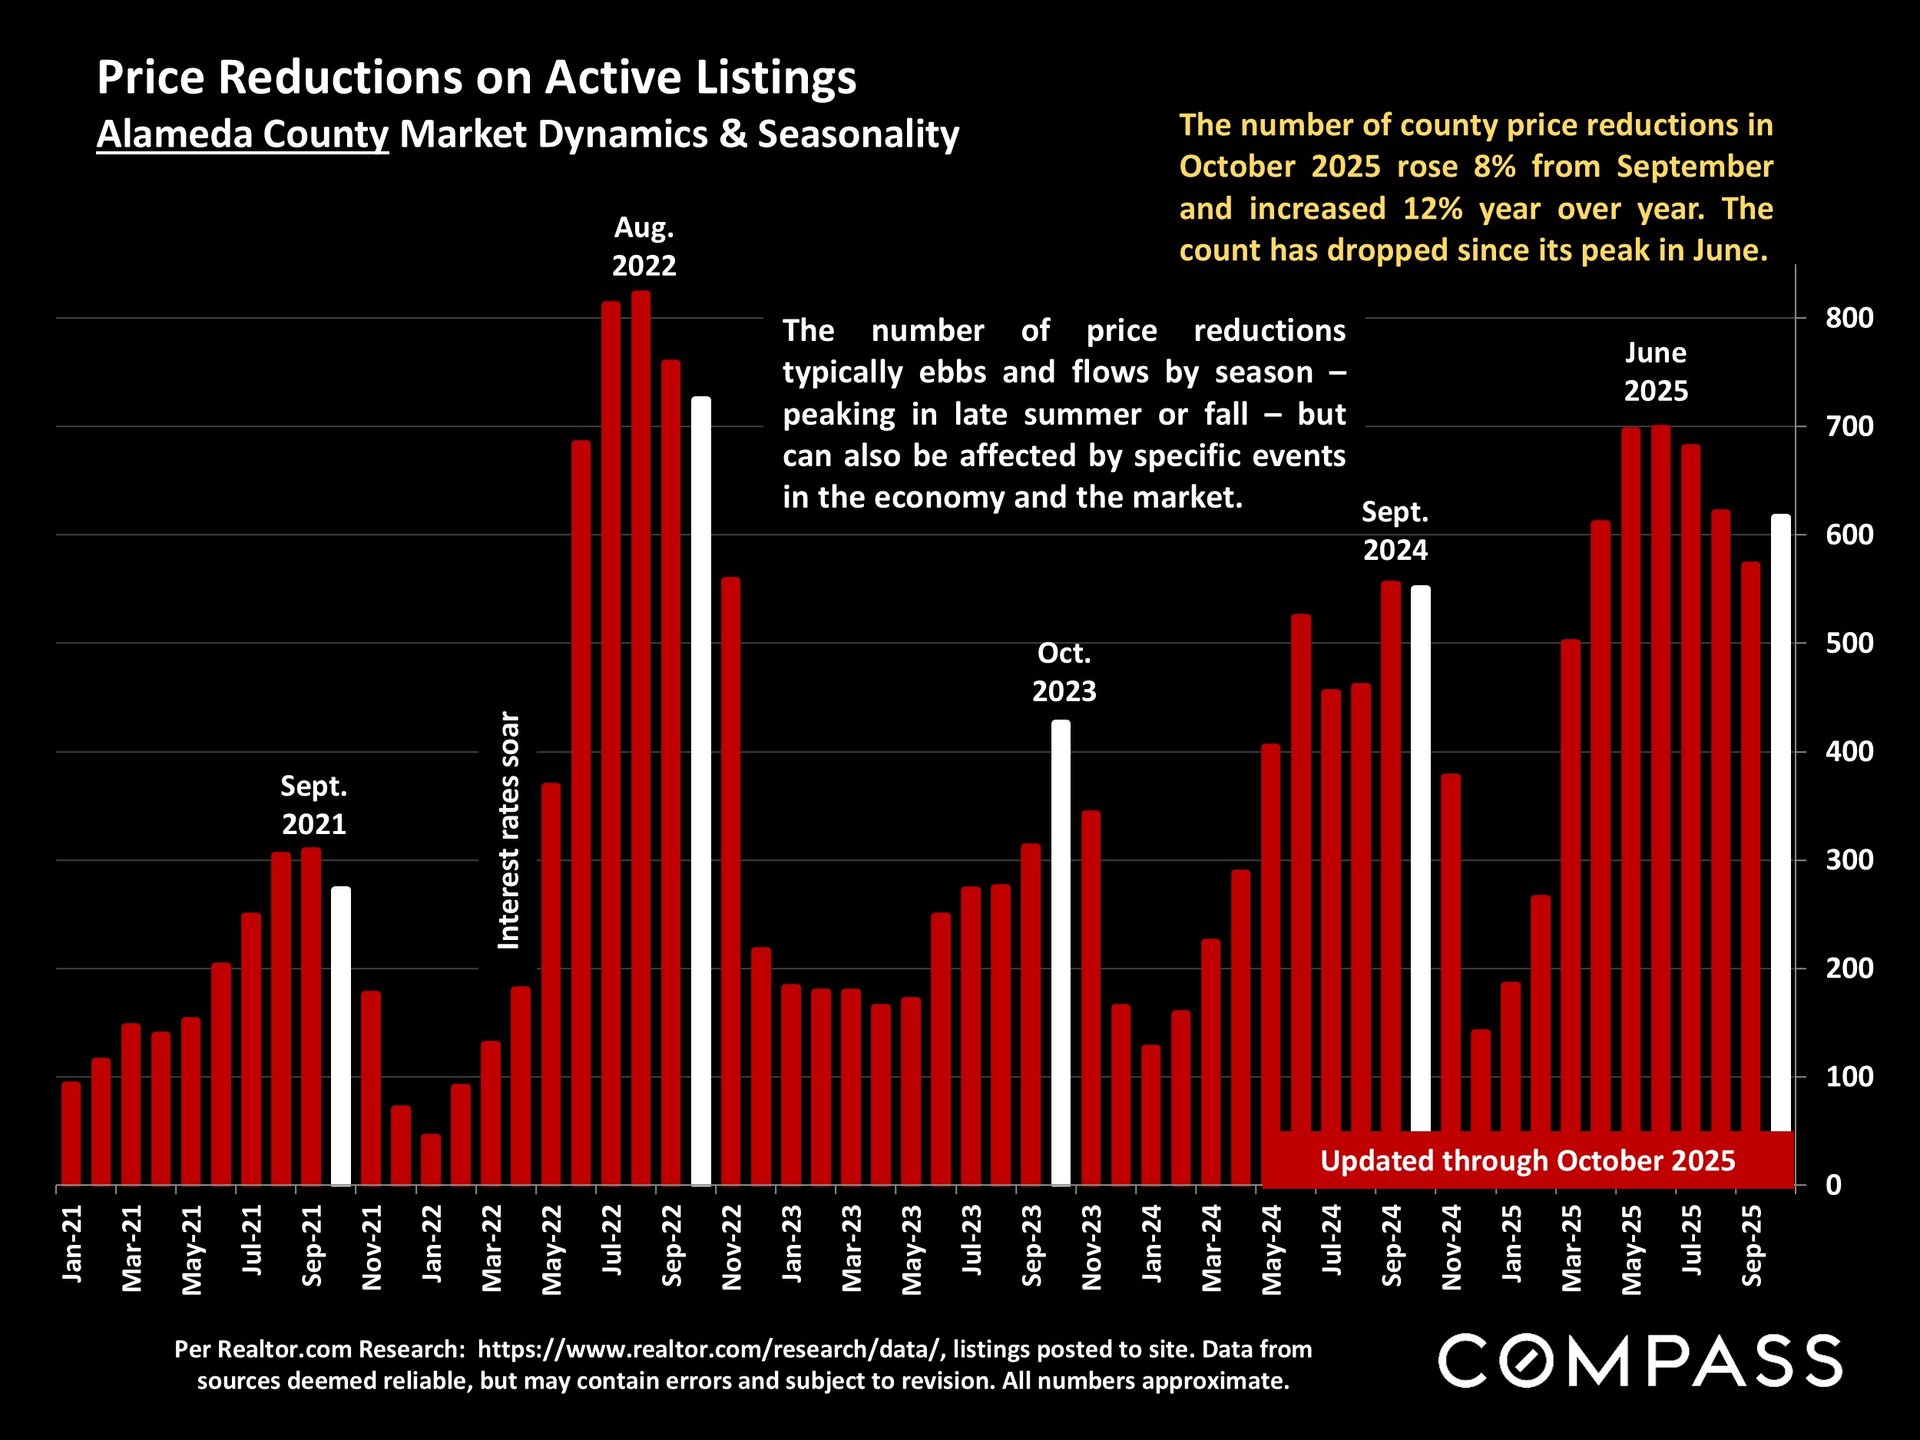
Alameda County active-listing price reduction chart, with monthly bars through October 2025 and seasonal annotations.

Sale-to-List Ratio (Nov 2025 vs. Nov 2024)

• San Mateo: 103% → 102%
• Santa Clara: 103% → 102%
• Alameda: 102% → 99%
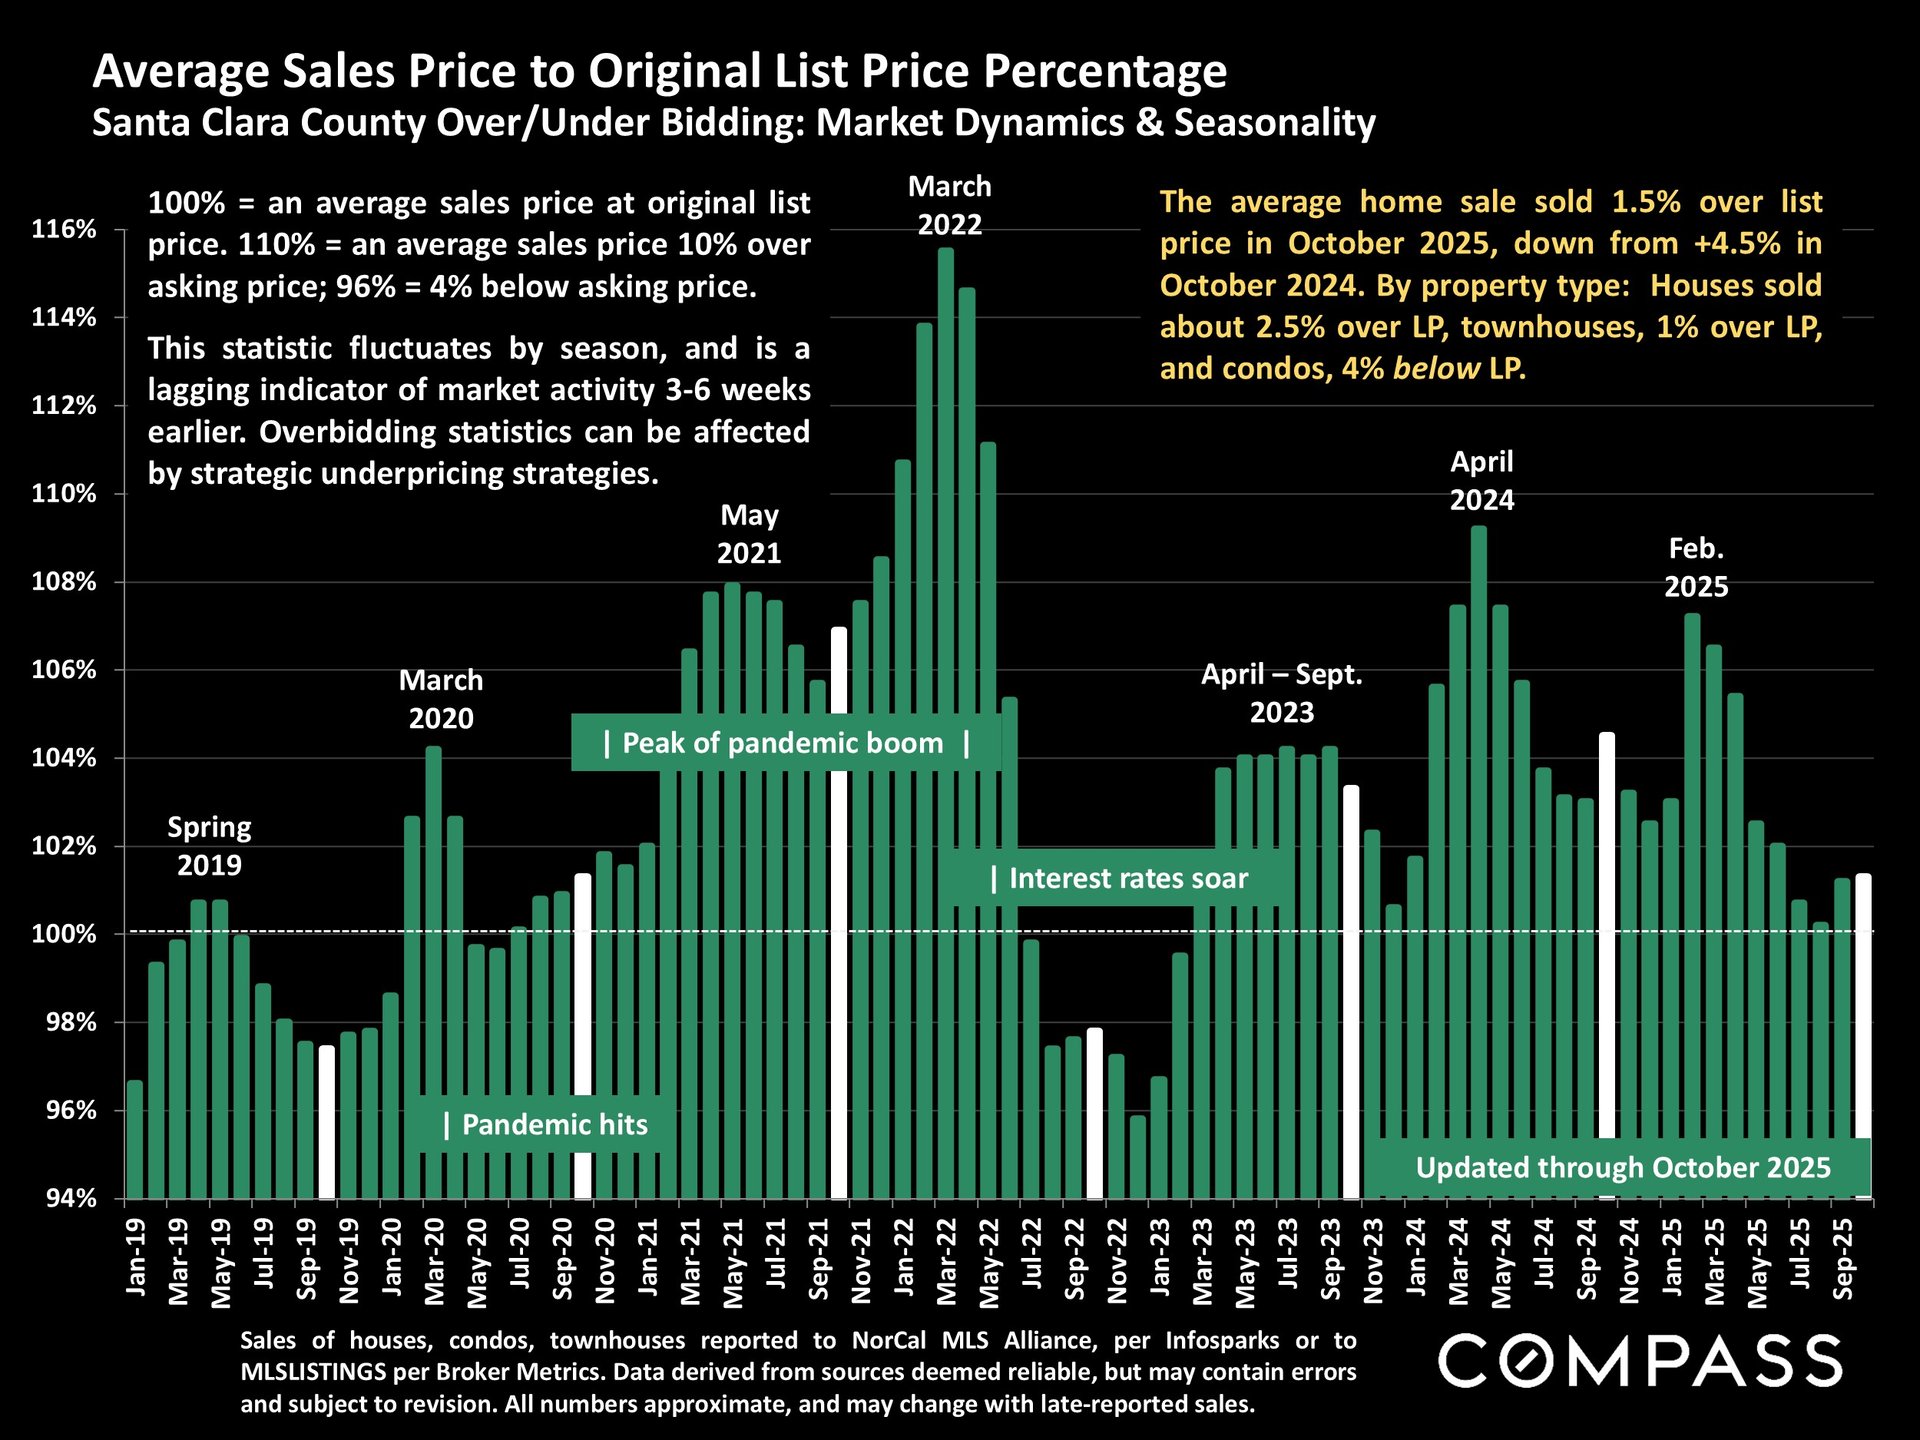
Santa Clara County sale-to-list price chart, with monthly bars from 2019 to 2025 and an October 2025 market summary.

Santa Clara County sale-to-list price chart, with monthly bars from 2019 to 2025 and an October 2025 market summary.

Santa Clara County active and coming-soon listings chart, with monthly counts from 2022 to 2025 and a November 2025 market summary.

Days on Market (Nov 2025 vs. Nov 2024)

• San Mateo: 21 → 28
• Santa Clara: 21 → 29
• Alameda: 20 → 34
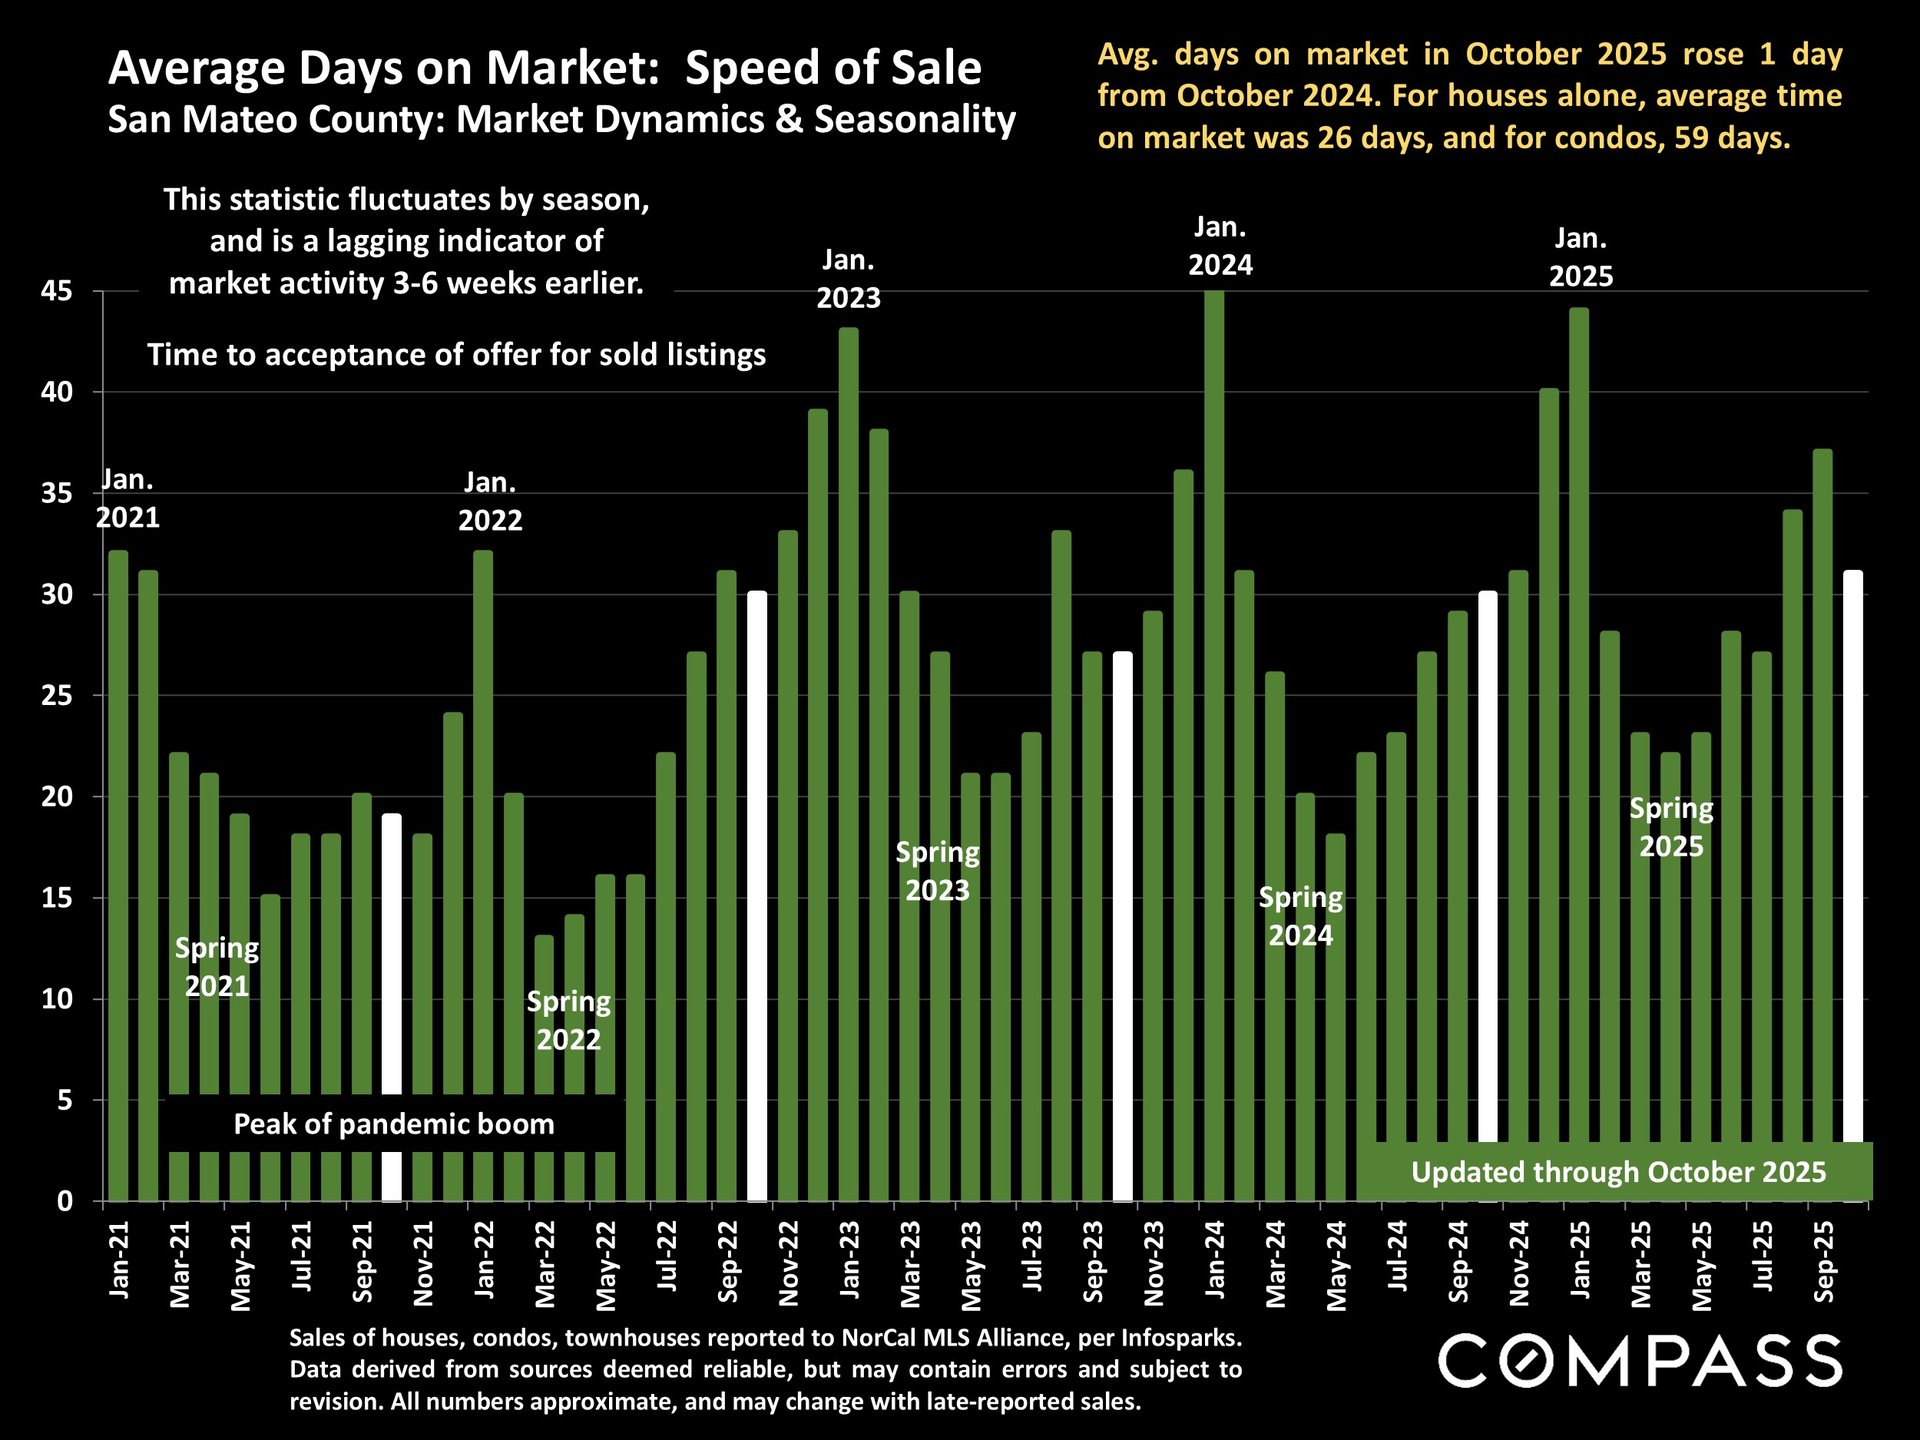
San Mateo County days-on-market chart, with monthly bars from 2021 to 2025 and seasonal annotations.

Santa Clara County sale-to-list price chart, with monthly bars from 2019 to 2025 and an October 2025 market summary.

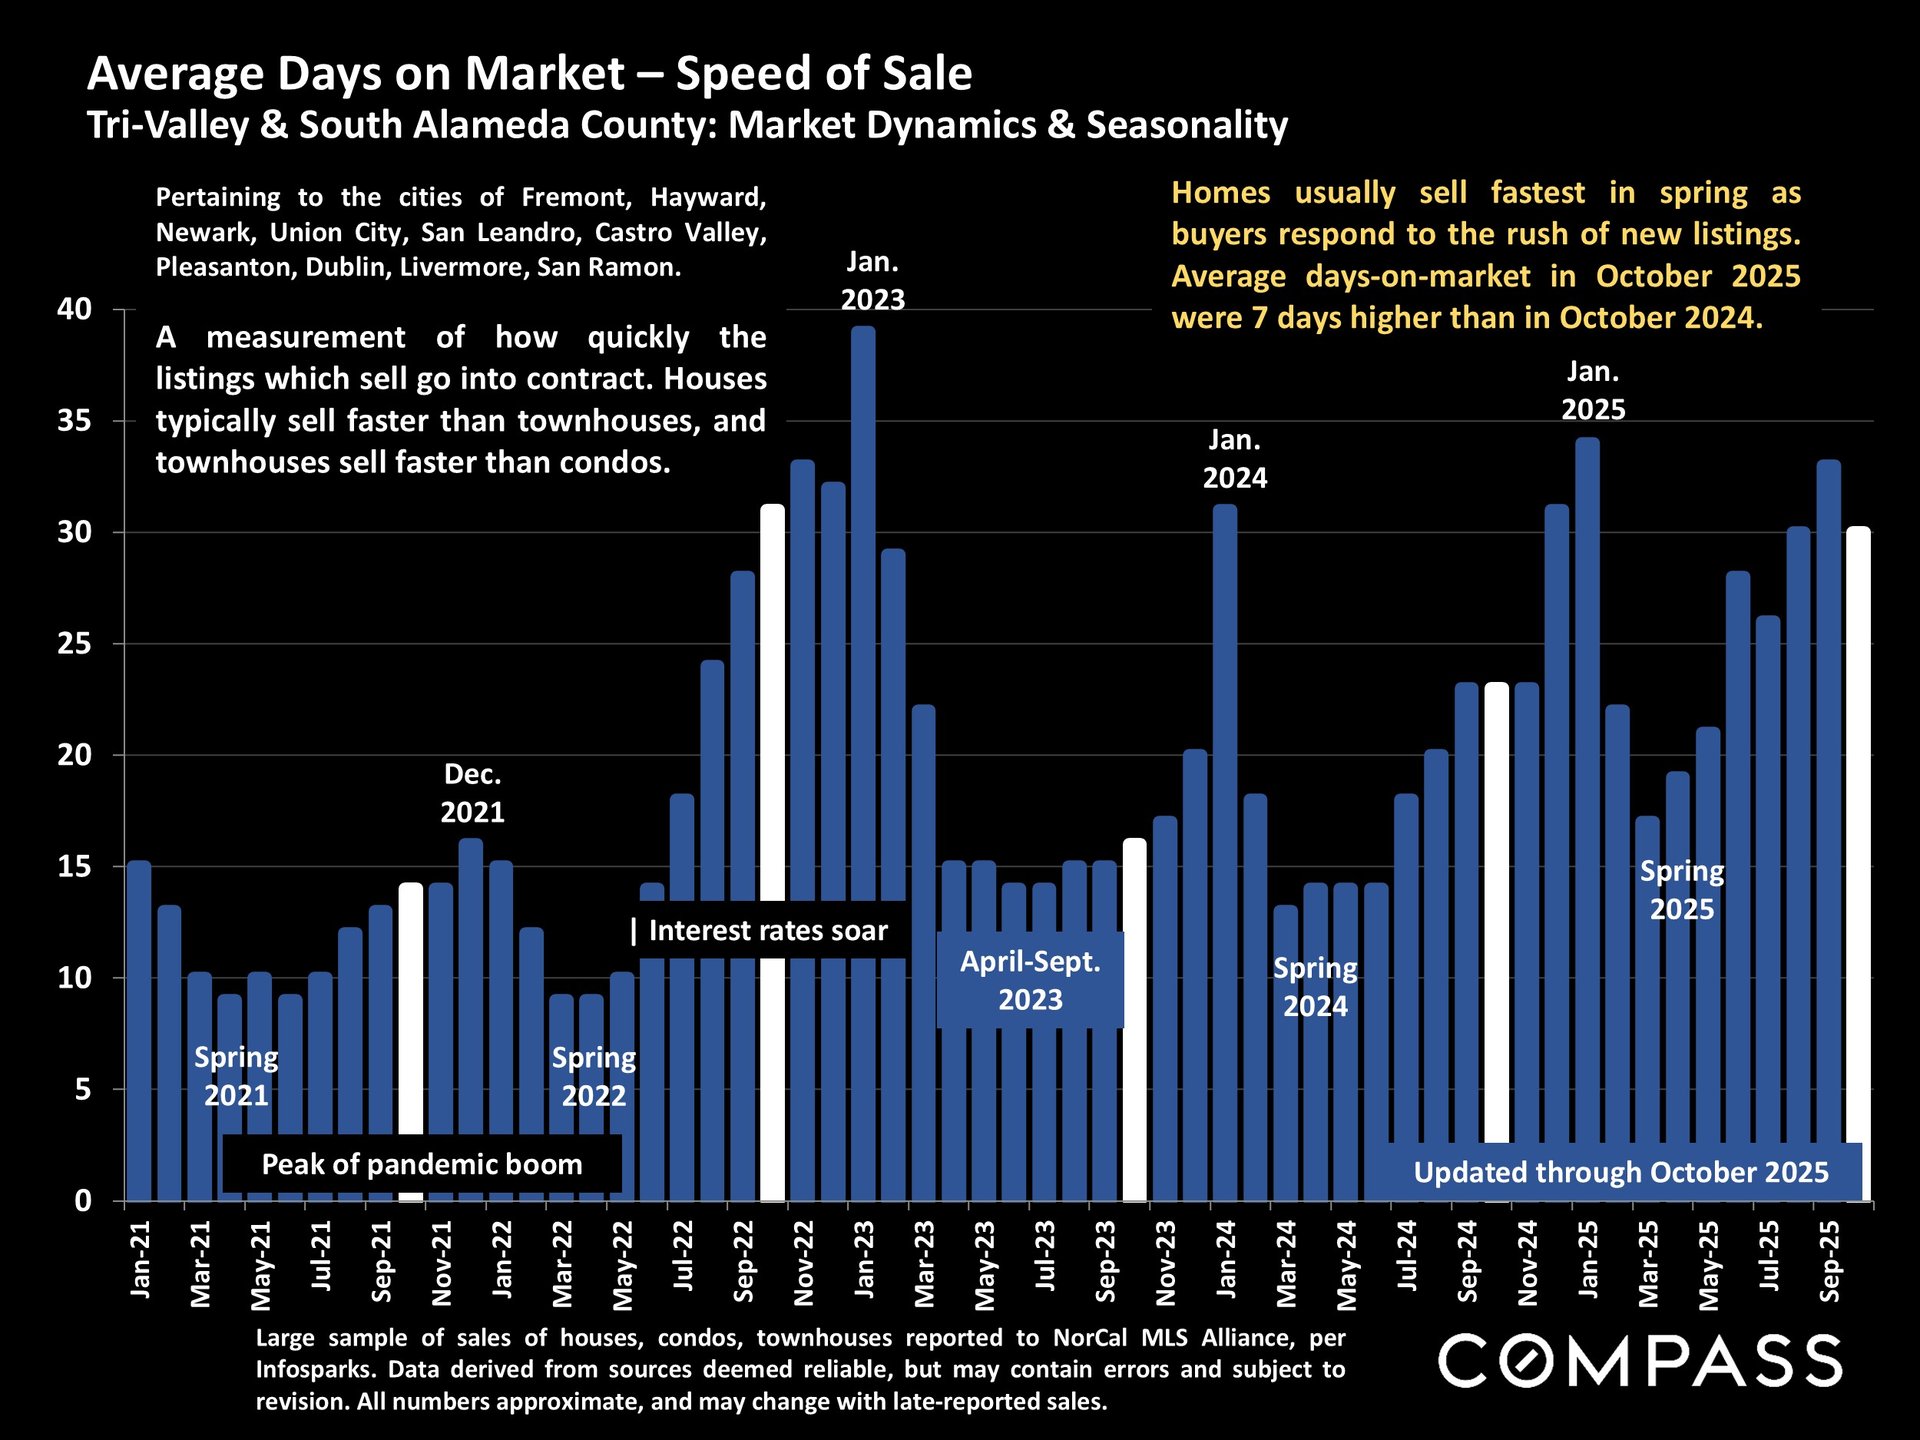
Bar chart of Tri-Valley and South Alameda County days on market, with monthly values from 2021 through October 2025.

Months of Inventory (Nov 2025 vs. Nov 2024)

• San Mateo: 2.0 → 2.4 months
• Santa Clara: 1.8 → 2.2 months
• Alameda: 2.1 → 2.5 months


Pending Sales (Nov 2025 vs. Nov 2024)

• San Mateo: –7%
• Santa Clara: –9%
• Alameda: –11%
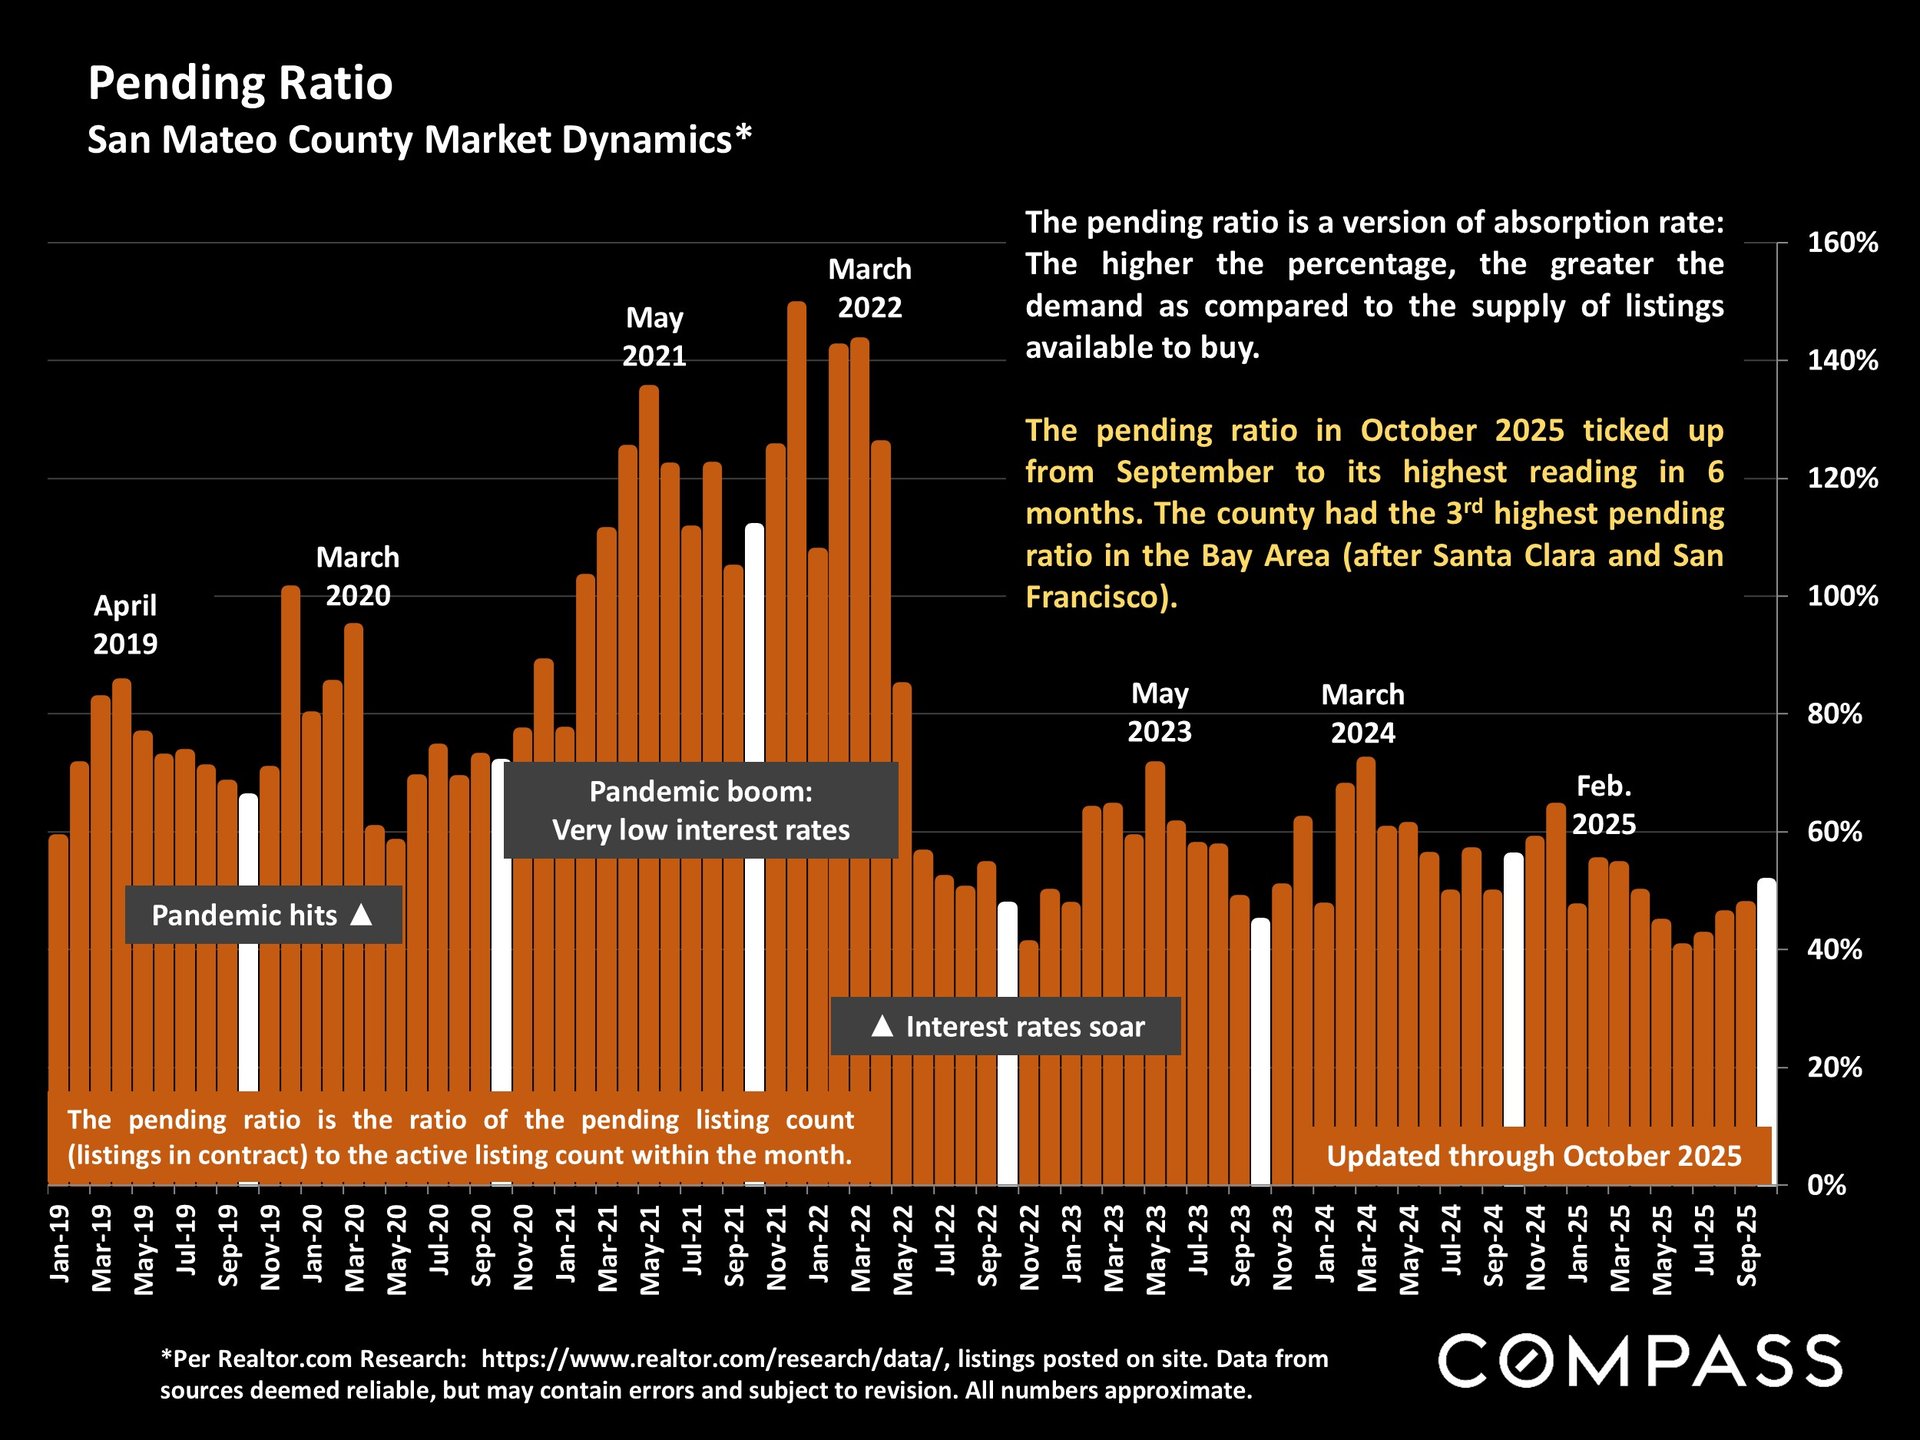
Bar chart of San Mateo County pending ratios from 2019 to October 2025, with pandemic and interest-rate annotations.

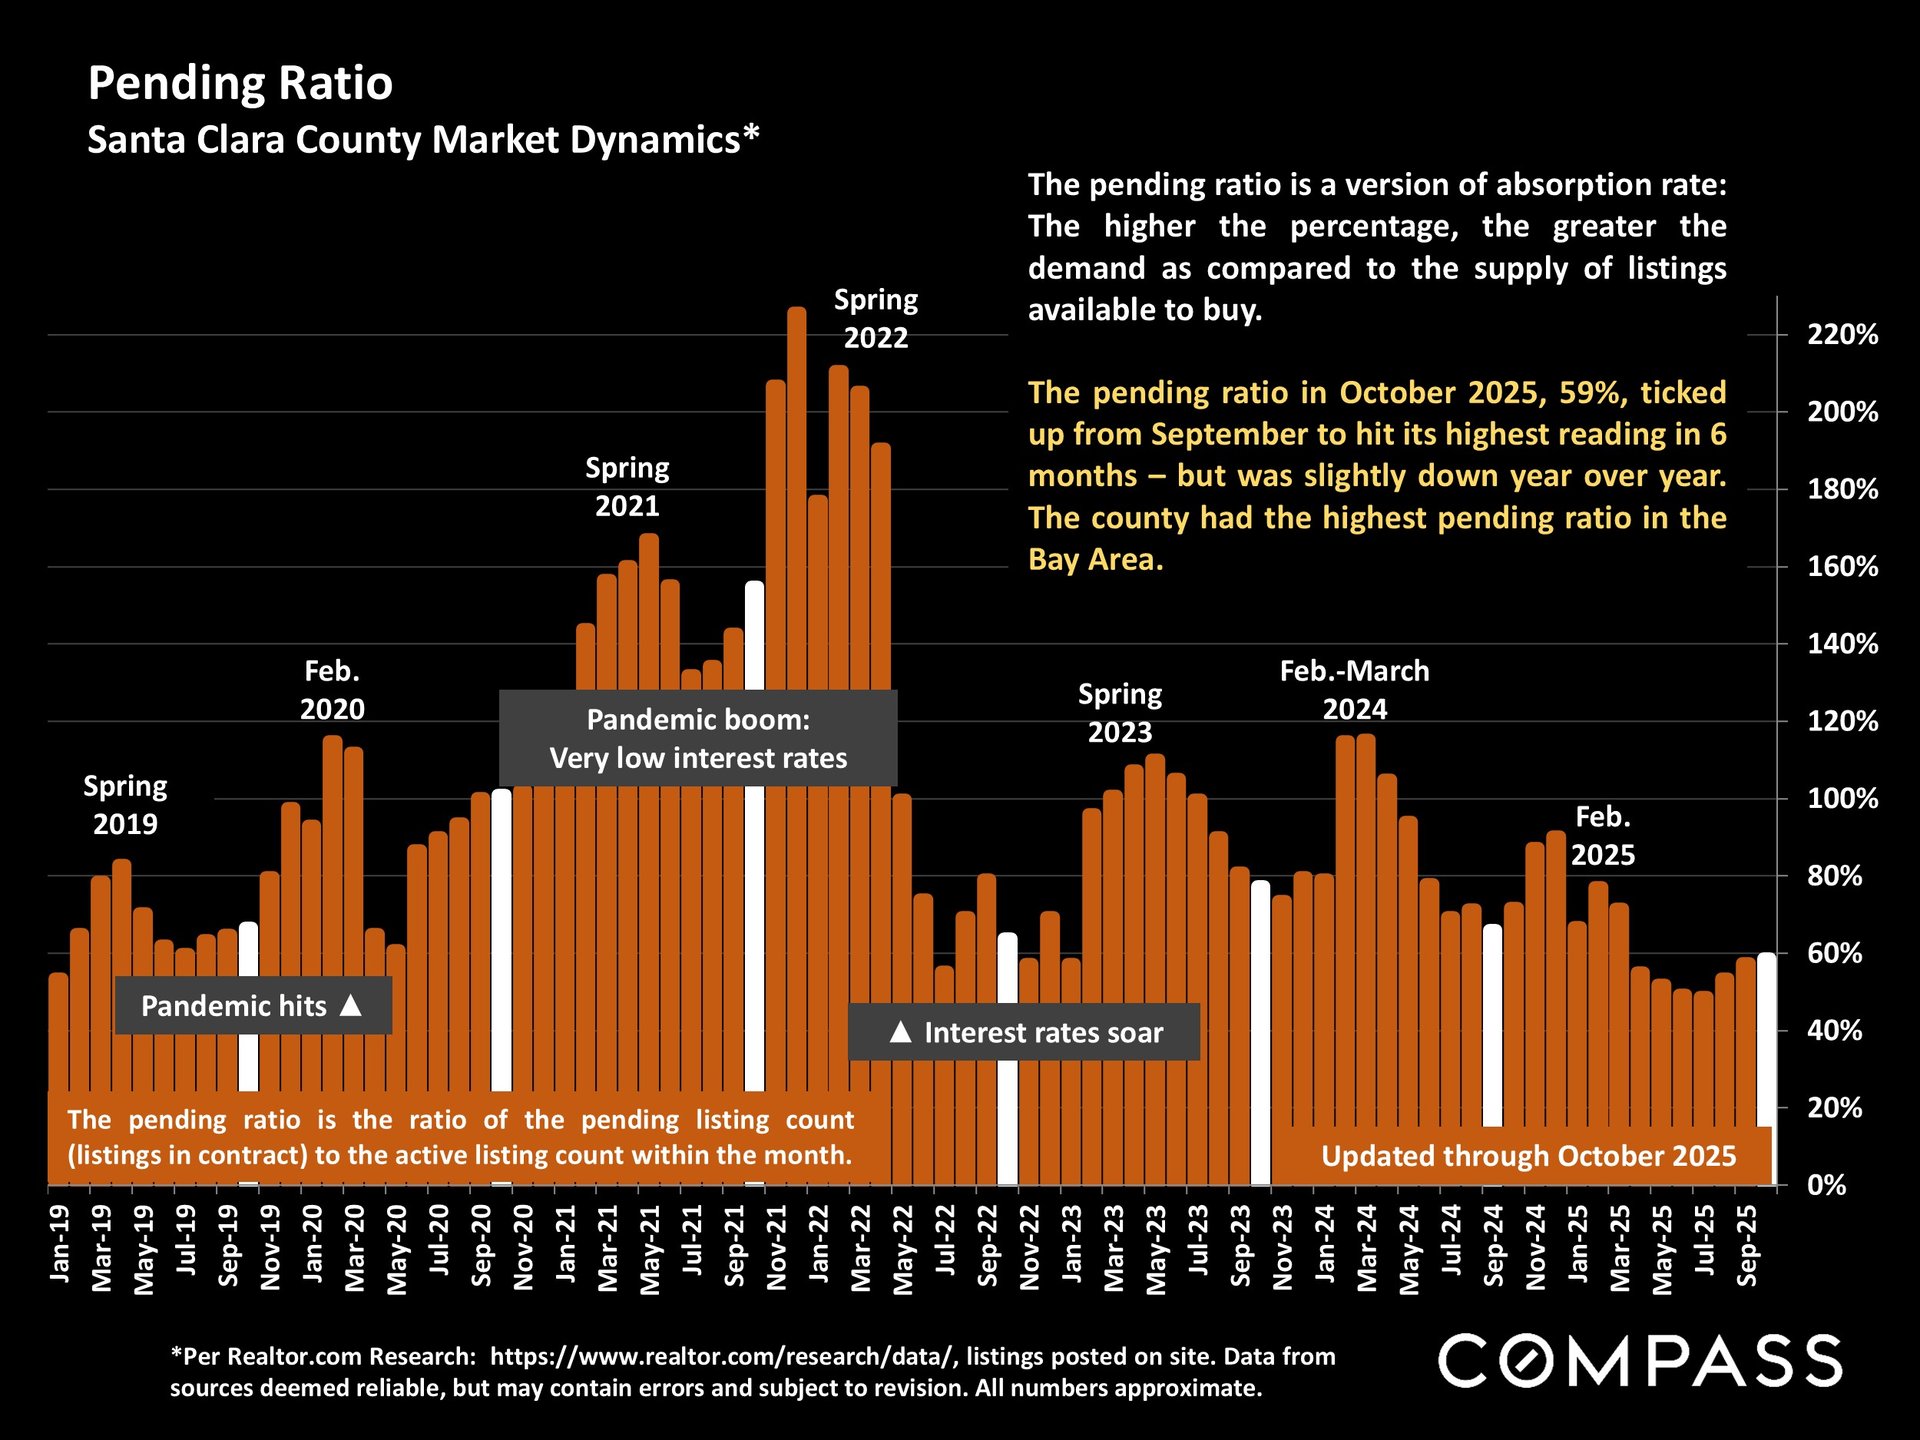
Santa Clara County pending-ratio chart, showing 59% in October 2025, the highest reading in six months.

Two Key Takeaways

• Market activity remains soft but stable. Pending sales are holding close to last year’s levels.
• Inventory and pricing pressure are increasing, giving buyers more leverage and pushing sellers toward more realistic pricing.


Off-Market Advantage

Did you know that checking Zillow alone can cause you to miss 700+ off-market listings in the Bay Area?
This was before Anywhere merged with Compass, making the off-market ecosystem even larger.

Call us today to unlock customized off-market opportunities and receive a free consultation:
📞 650-630-9810
Work With Us

With trusted and tested contacts in the mortgage industry, we can provide you with a critical edge during the mortgage qualification and pre-approval process, ensuring a seamless transaction.

Follow Me on Instagram